Litecoin price gains mesmerize, but technicals at a crossroads
- Litecoin price punches key Fibonacci resistance before closing in the lower third of the weekly range.
- Bearish momentum divergence on weekly Relative Strength Index (RSI) is a barrier to new highs.
- Significant clusters of resistance shown on the IOMAP data.

Litecoin price corrected 28% during the broad cryptocurrency meltdown on the weekend but did close positive for the week with a gain of almost 9%. The popular narrative in the crypto channels is that LTC will test the all-time high at $420 in days, but some technical evidence indicates that the alt-coin may have printed the high, at least for the short term.
Litecoin price accumulation in 2021 reflects increasing global adoption
The growing interest in LTC is shown in a chart of the number of unique addresses that appeared for the first time in a transaction of the native coin in the network. The numbers rose in tandem with price through the whole rally from 2020.
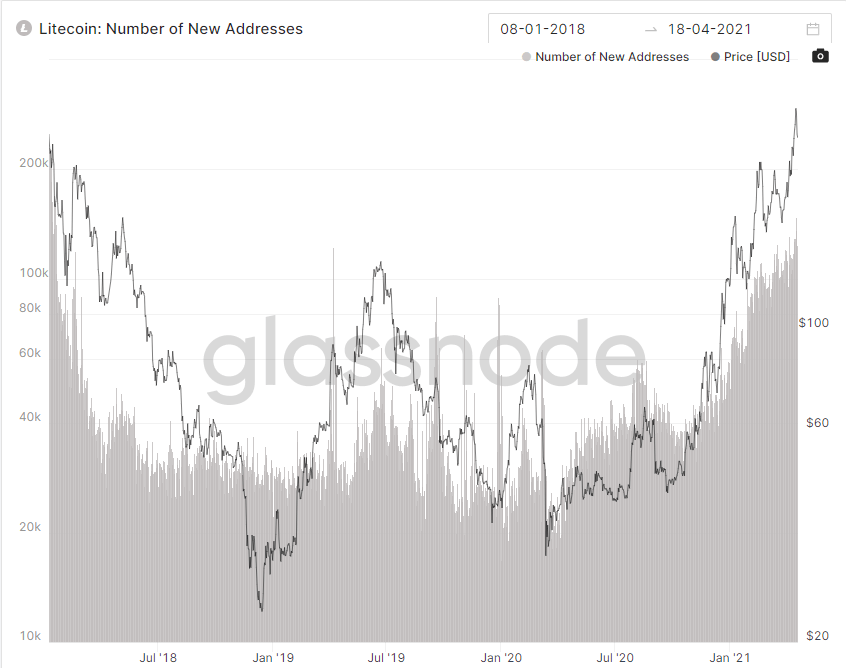
Litecoin New Addresses: Glassnode
In the latest Intotheblock In/Out of the Money Around Price (IOMAP) data, there is overwhelming evidence of discouraging resistance at two price ranges. First, from $268.57 to $276.60, where 106.63k addresses bought 1.92 million LTC. The range is slightly above the 61.8% retracement of the 2017-2018 bear market at $268.06. Second, from $284.62 to $292.65, where 42.12k addresses bought 2.67 million LTC. It is slightly above the high of today. Together, they will discourage even the most bullish speculators.
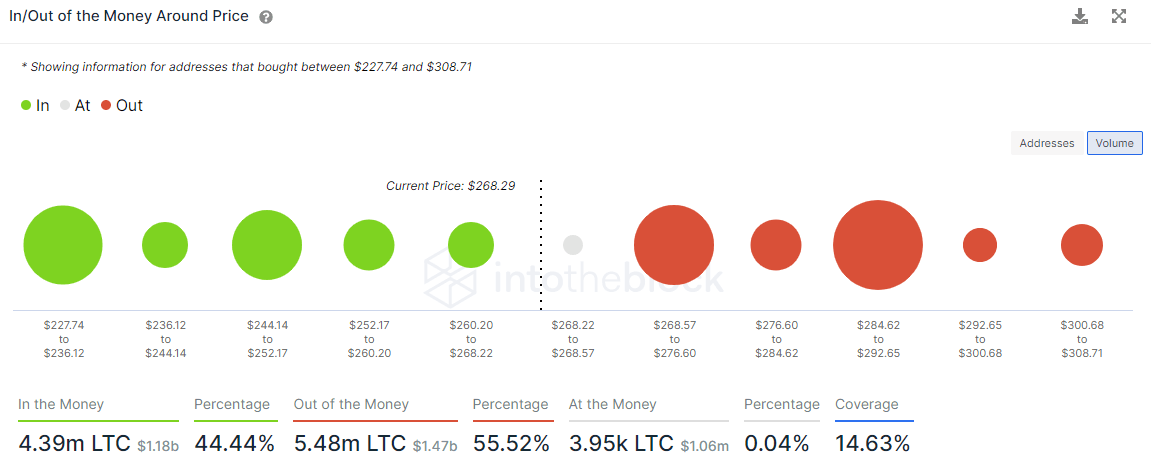
LTC IOMAP data
With the all-time high only 55% from the current price, it does not mean that LTC will resume the rally. Last week LTC rallied to the 78.6% retracement level of the 2017-2018 bear market at $334.88 before quickly reversing. The rush into new highs was built upon the previous week’s breakout, but the price highs were not confirmed by the weekly RSI for the second time since February, highlighting the waning momentum of the rally.
The current outlook with a slight negative bias anticipates a churn in the current range, contained by the bottleneck of two large out of the money clusters. Initial support is $247, and it was tested during the weekend flash crash. The next layer of support is the critical 10-week simple moving average (SMA) at $217.67. LTC has not closed below the moving average on a closing basis since October 2020.
If price disperses with the 10-week SMA, it would at least raise the odds that a deeper, more extended correction will overcome LTC, and the predictions of a new all-time will need to be locked away until later this year.
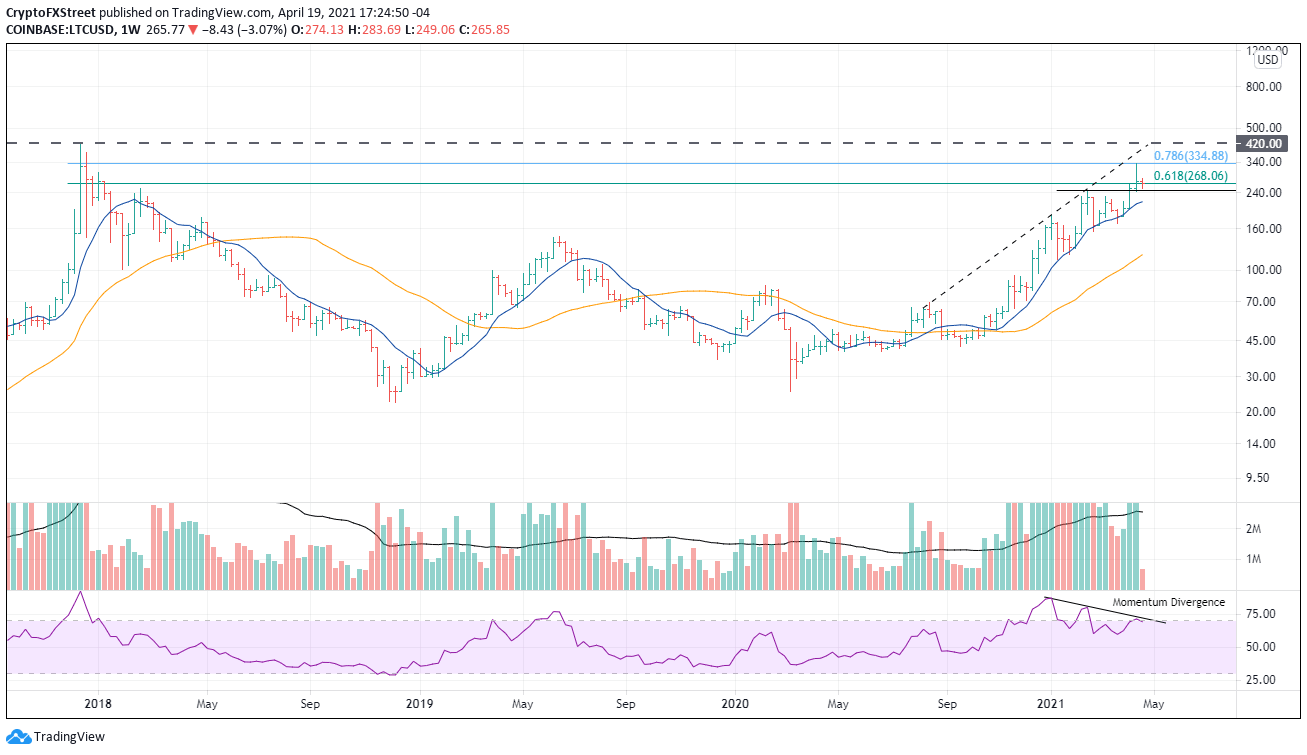
LTC/USD weekly chart
Arguably, the ideal scenario for the price is to oscillate in a tight range with a mild downward drift and let the moving averages catch up to the price, and reset the RSI. Of course, a stampede of buying could emerge. It needs to overcome the $334.88 price level before knocking on the door of the all-time high at $420.00. Additional upside would need to be evaluated at that time.
Author

Sheldon McIntyre, CMT
Independent Analyst
Sheldon has 24 years of investment experience holding various positions in companies based in the United States and Chile. His core competencies include BRIC and G-10 equity markets, swing and position trading and technical analysis.


