Litecoin Price Forecast: LTC market value primed to double within the next few weeks
- Litecoin prepares for a gigantic upswing to its all-time highs at $420.
- LTC prints a similar long-term technical picture to Ethereum’s on the weekly chart.
- Holders remain on a buying spree as the MVRV suggests Litecoin is still in the ‘buy zone.’
- The majestic uptrend to $420 may fail to materialize if LTC dives under the IOMAP support at $420.

Litecoin recently rose above 2020’s high, drawing much closer to $200. However, a barrier at $190 put a halt to the massive upswing. After confirming support at $110, LTC has embarked on recovery, eyeing the all-time high at $420.
Litecoin could mimic Ethereum breaking out to all-time highs
The weekly charts of Ethereum and Litecoin look quite similar, suggesting that Litecoin is on the verge of a massive breakout. From a comprehensive look at the ETH chart, we can see a ballistic rise to $492 in June 2020, followed by a correction to $300.
The pioneer cryptocurrency then embarked on an unending rally towards the end of the year. A rise in investor interest, backed by the crypto bull run, saw Ethereum step above $1,000 In January 2021. At the moment, Ethereum is trading at new record highs as bulls are eyeing $2,000.
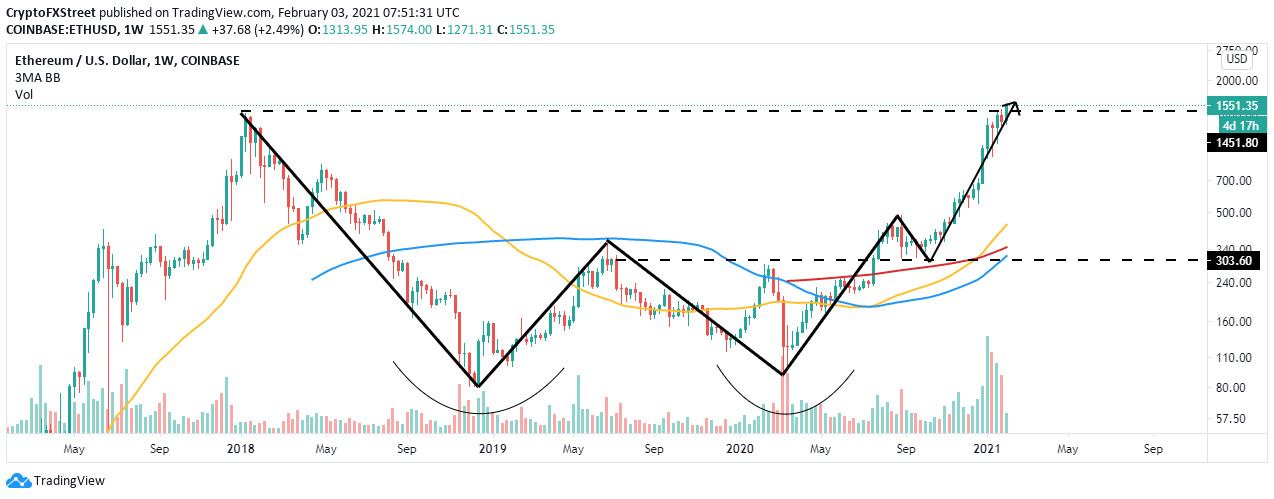
ETH/USD weekly chart
Intriguingly, Litecoin is taking a similar pattern that could see it more than double in price, with gains eyeing $400 (record highs). The recent rebound at $110 is essential for sustaining the uptrend, and, therefore, such level must be guarded at all costs.
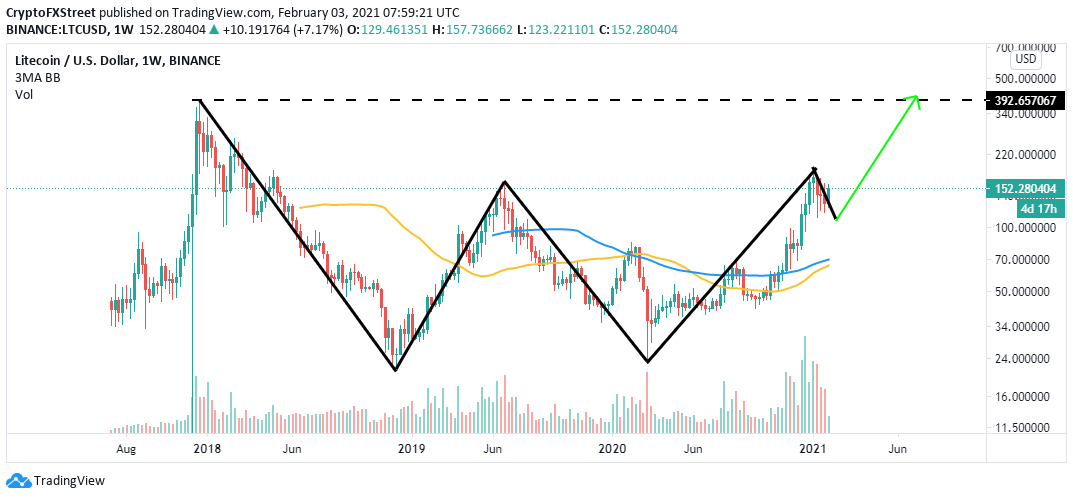
LTC/USD weekly chart
Litecoin’s large volume holders on a buying spree
The buying spree among the whales reinforces the bullish outlook. Santiment’s holder distribution brings to light the persistent rise in the number of addresses holding between 10,000 and 100,000 LTC.
%20[13.34.28,%2003%20Feb,%202021]-637479492176237481.png)
LTC/USD holder distribution chart
The on-chain metric, calculated on a 30-day moving average, shows whales bottomed at roughly 400 on January 24.
Over the past couple of weeks, the addresses have increased to 420, representing a 4.8% growth. If the accumulation continues, buying pressure will intensify behind Litecoin, eventually pushing the price on an upward trajectory.
Litecoin still in the buy zone
According to the MVRV, an on-chain metric by Santiment, Litecoin recently returned into the buy zone. The MVRV measures the average profit or loss as per the current LTC holders in relation to the last time the tokens were transferred.
A higher MVRV figure suggests that most or all LTC holders are in profit. However, the chart shows a recent dip and an ongoing recovery of the MVRV. Thus, Litecoin offers entry positions within the “opportunity zone.”
%20[13.34.28,%2003%20Feb,%202021]-637479479616922251.png)
Litecoin MVRV model
Simultaneously, the IOMAP model by IntoTheBlock reveals little resistance that could hinder Litecoin’s rally. However, it essential to keep in mind the subtle resistance between $169 and $174.
Here, roughly 34,000 addresses had formerly bought nearly 962,000 LTC in this zone. Breaking above this zone could catapult Litecoin above $200, perhaps jumpstarting the rally to the record highs.
On the downside, immense support has been established to ensure that declines are kept at bay, especially at $137 to $142. Here, approximately 113,000 addresses had previously purchased roughly 4.8 million LTC.
-637479481680252977.png)
Litecoin IOMAP chart
Looking it at the other side of the fence
It is essential to realize that the resistance between $190 and $200 could continue to delay the expected breakout. Simultaneously, if Litecoin fails to hold above the IOMAP support at $140, a downswing could occur, forcing the coin to revisit the support at $110. Other support levels to keep in mind include $80, the 100 Simple Moving Average and the 50 SMA on the weekly chart.
Author

John Isige
FXStreet
John Isige is a seasoned cryptocurrency journalist and markets analyst committed to delivering high-quality, actionable insights tailored to traders, investors, and crypto enthusiasts. He enjoys deep dives into emerging Web3 tren


