Litecoin price must stay above this critical support level to avoid a 35% drop - Confluence Detector
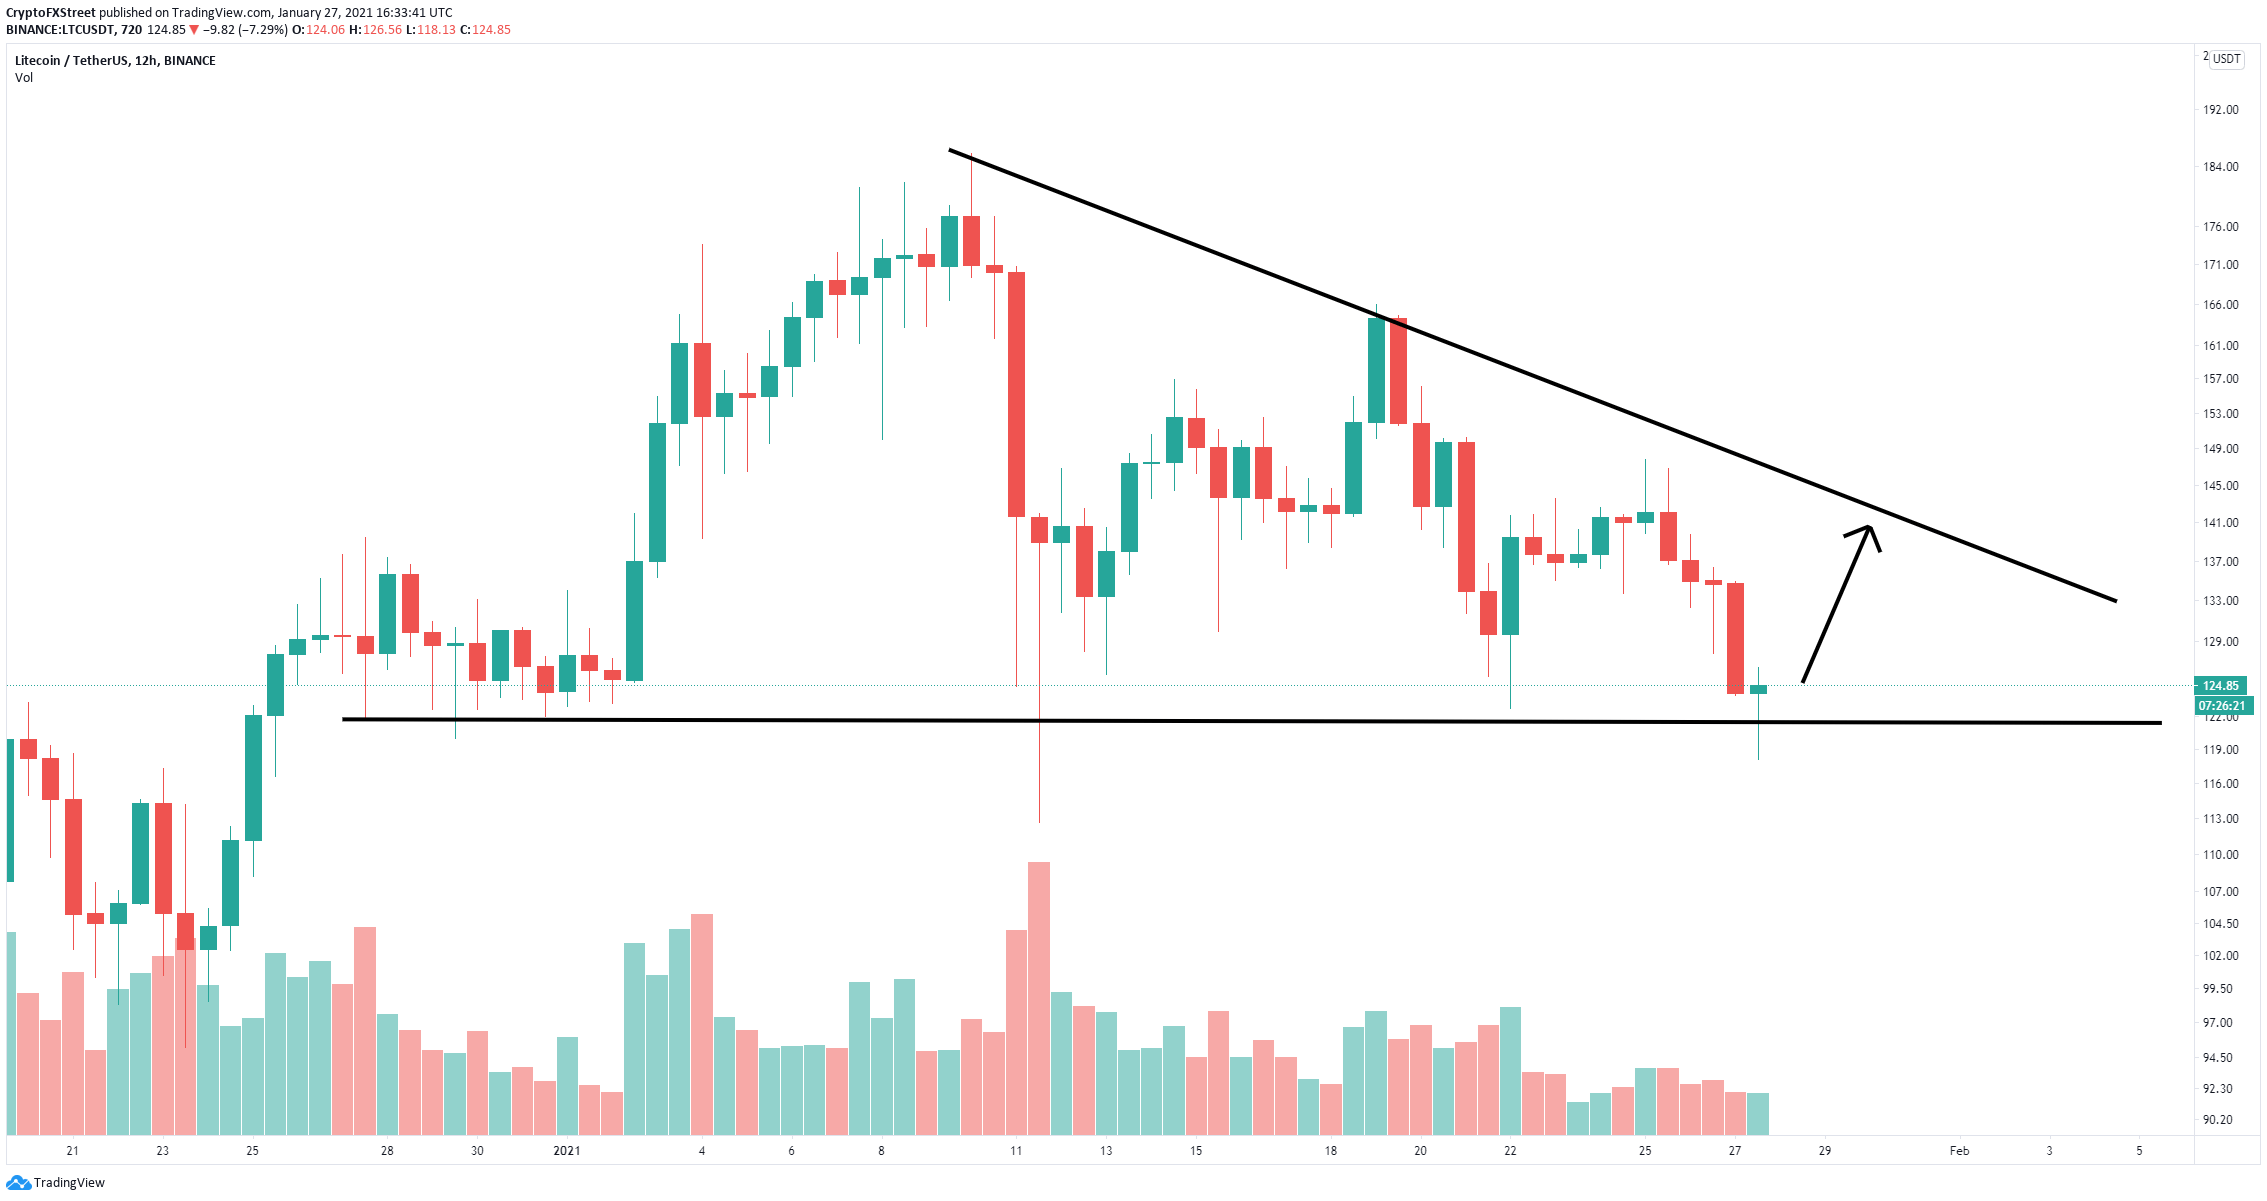
- Litecoin price has just defended a crucial support level at $121.
- The digital asset is trading inside a descending triangle pattern on the 12-hour chart.
- The TD Sequential indicator has presented a buy signal that can help the bulls.

Litecoin has been trading sideways in a consolidation pattern after reaching its 2021 top at $185. LTC bulls are trying to defend a crucial support level and push Litecoin price towards $140.
Litecoin price can quickly rise to $140 with this rebound
On the 12-hour chart, Litecoin established a descending triangle pattern with a support trendline located at $121. It seems that bulls have defended this level once again and LTC price has rebounded by 6% in just two hours after touching $118.
LTC/USD 12-hour chart
This rebound could push Litecoin towards the upper trendline at $140. On the 2-hour chart, the TD Sequential indicator has just presented a buy signal giving credence to the bullish rebound.
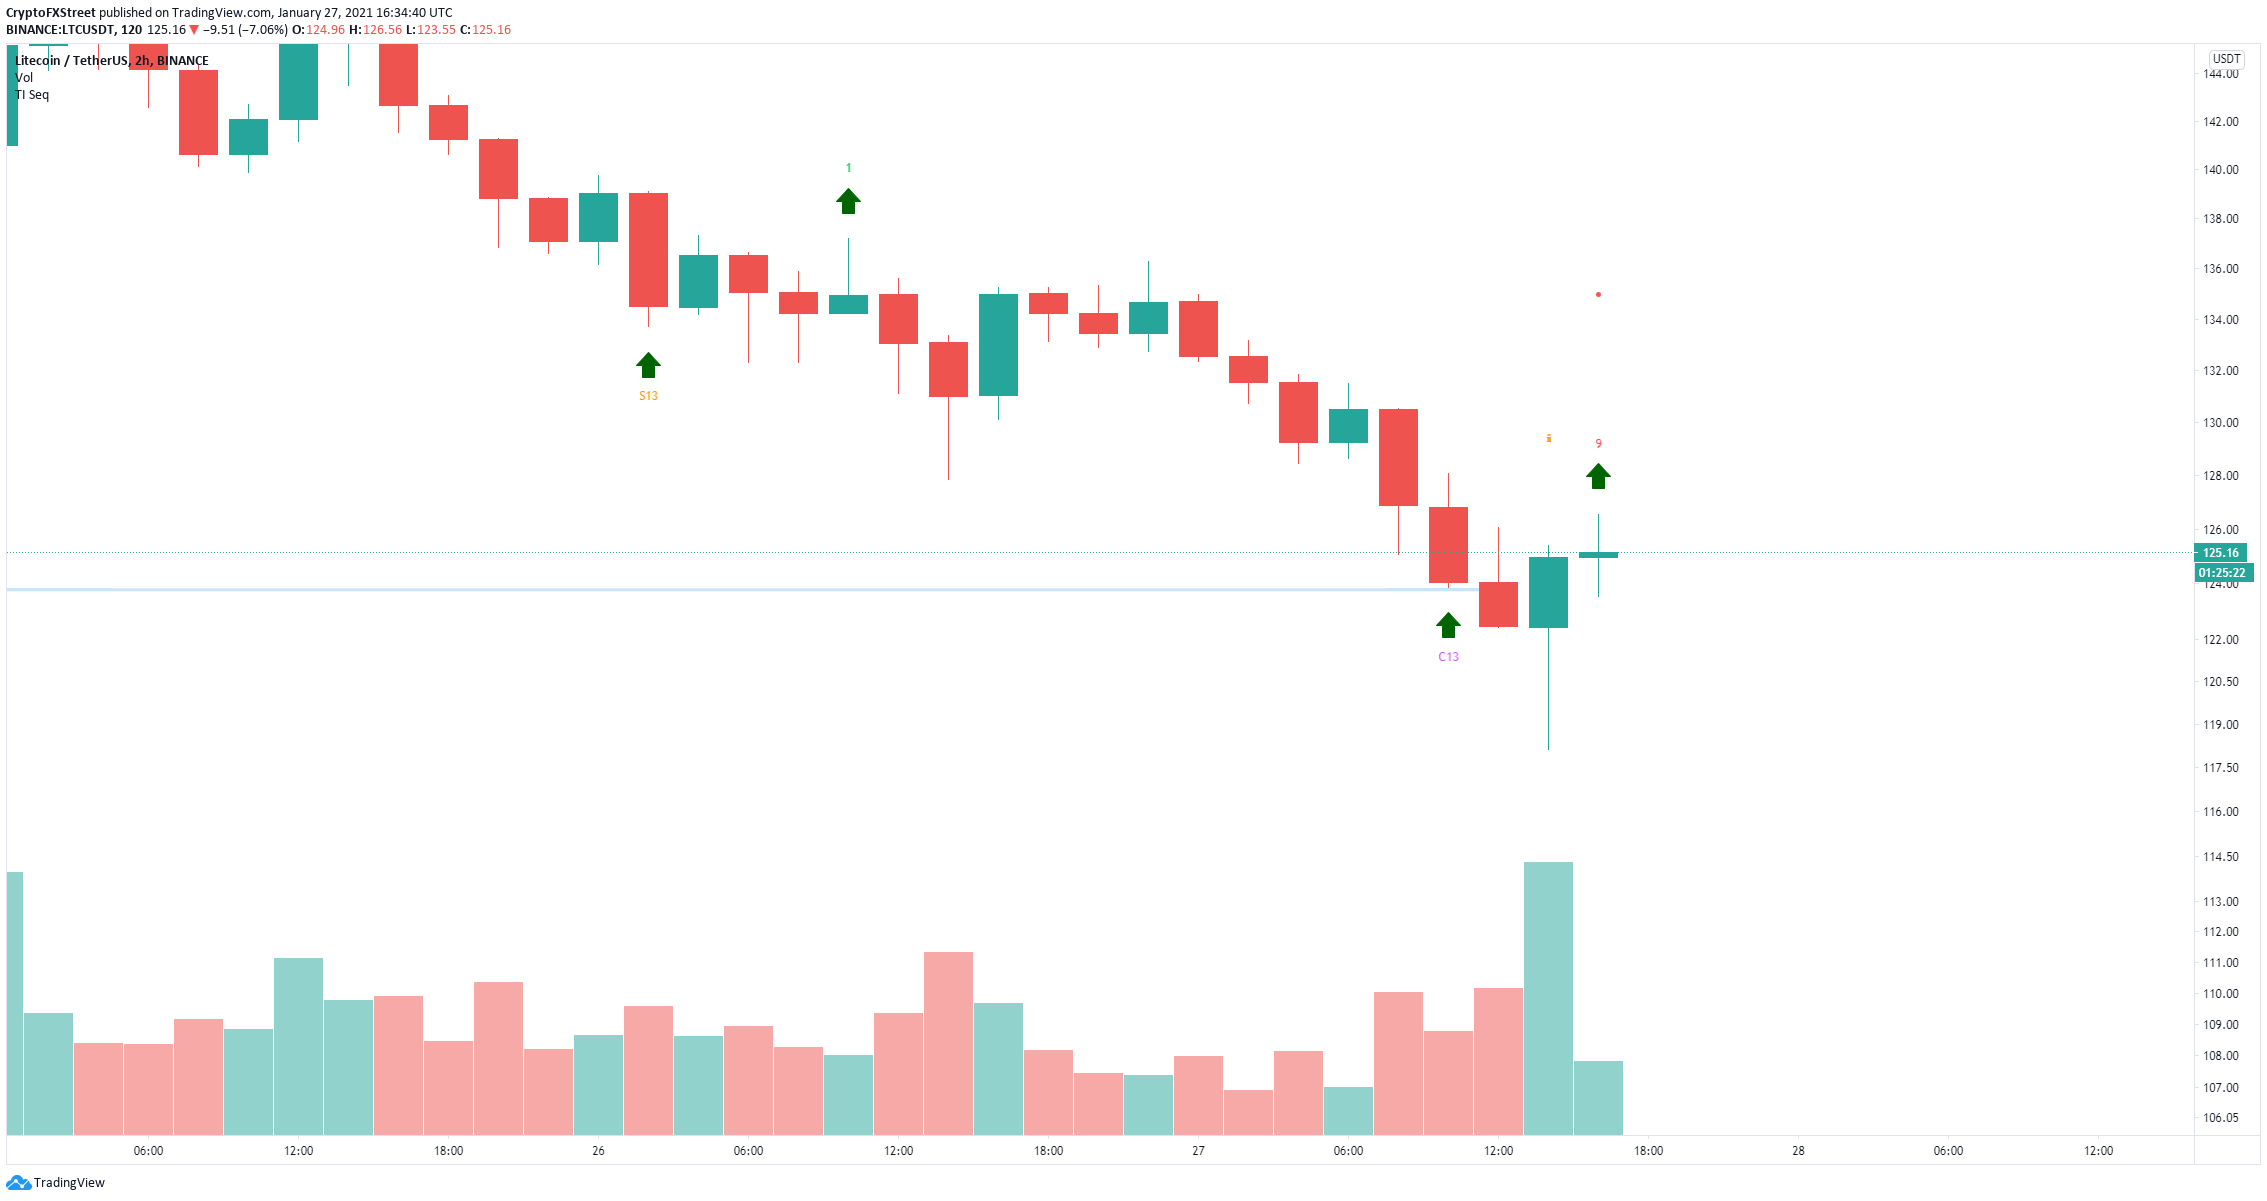
LTC/USD 2-hour chart
The In/Out of the Money Around Price (IOMAP) chart shows the most significant resistance area to be located between $136 and $140, which coincides with our price target above. In this area 4.8 million Litecoin was purchased by more than 104,000 addresses.
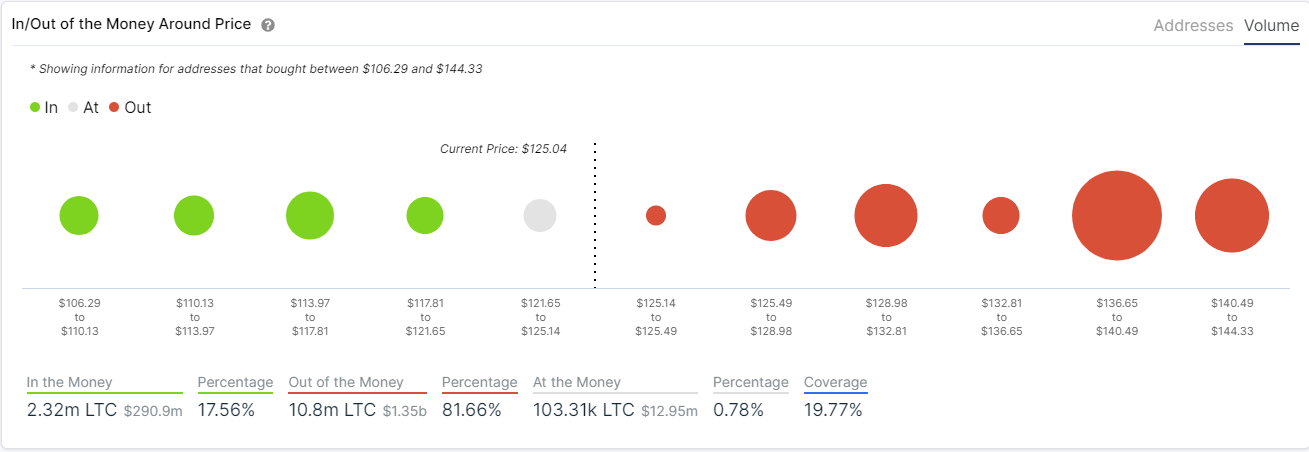
LTC IOMAP chart
However, the IOMAP model also indicates that support below $120 is scarce. A breakdown below $120 would be a bearish breakdown from the descending triangle pattern on the 12-hour chart with a price target of $78.
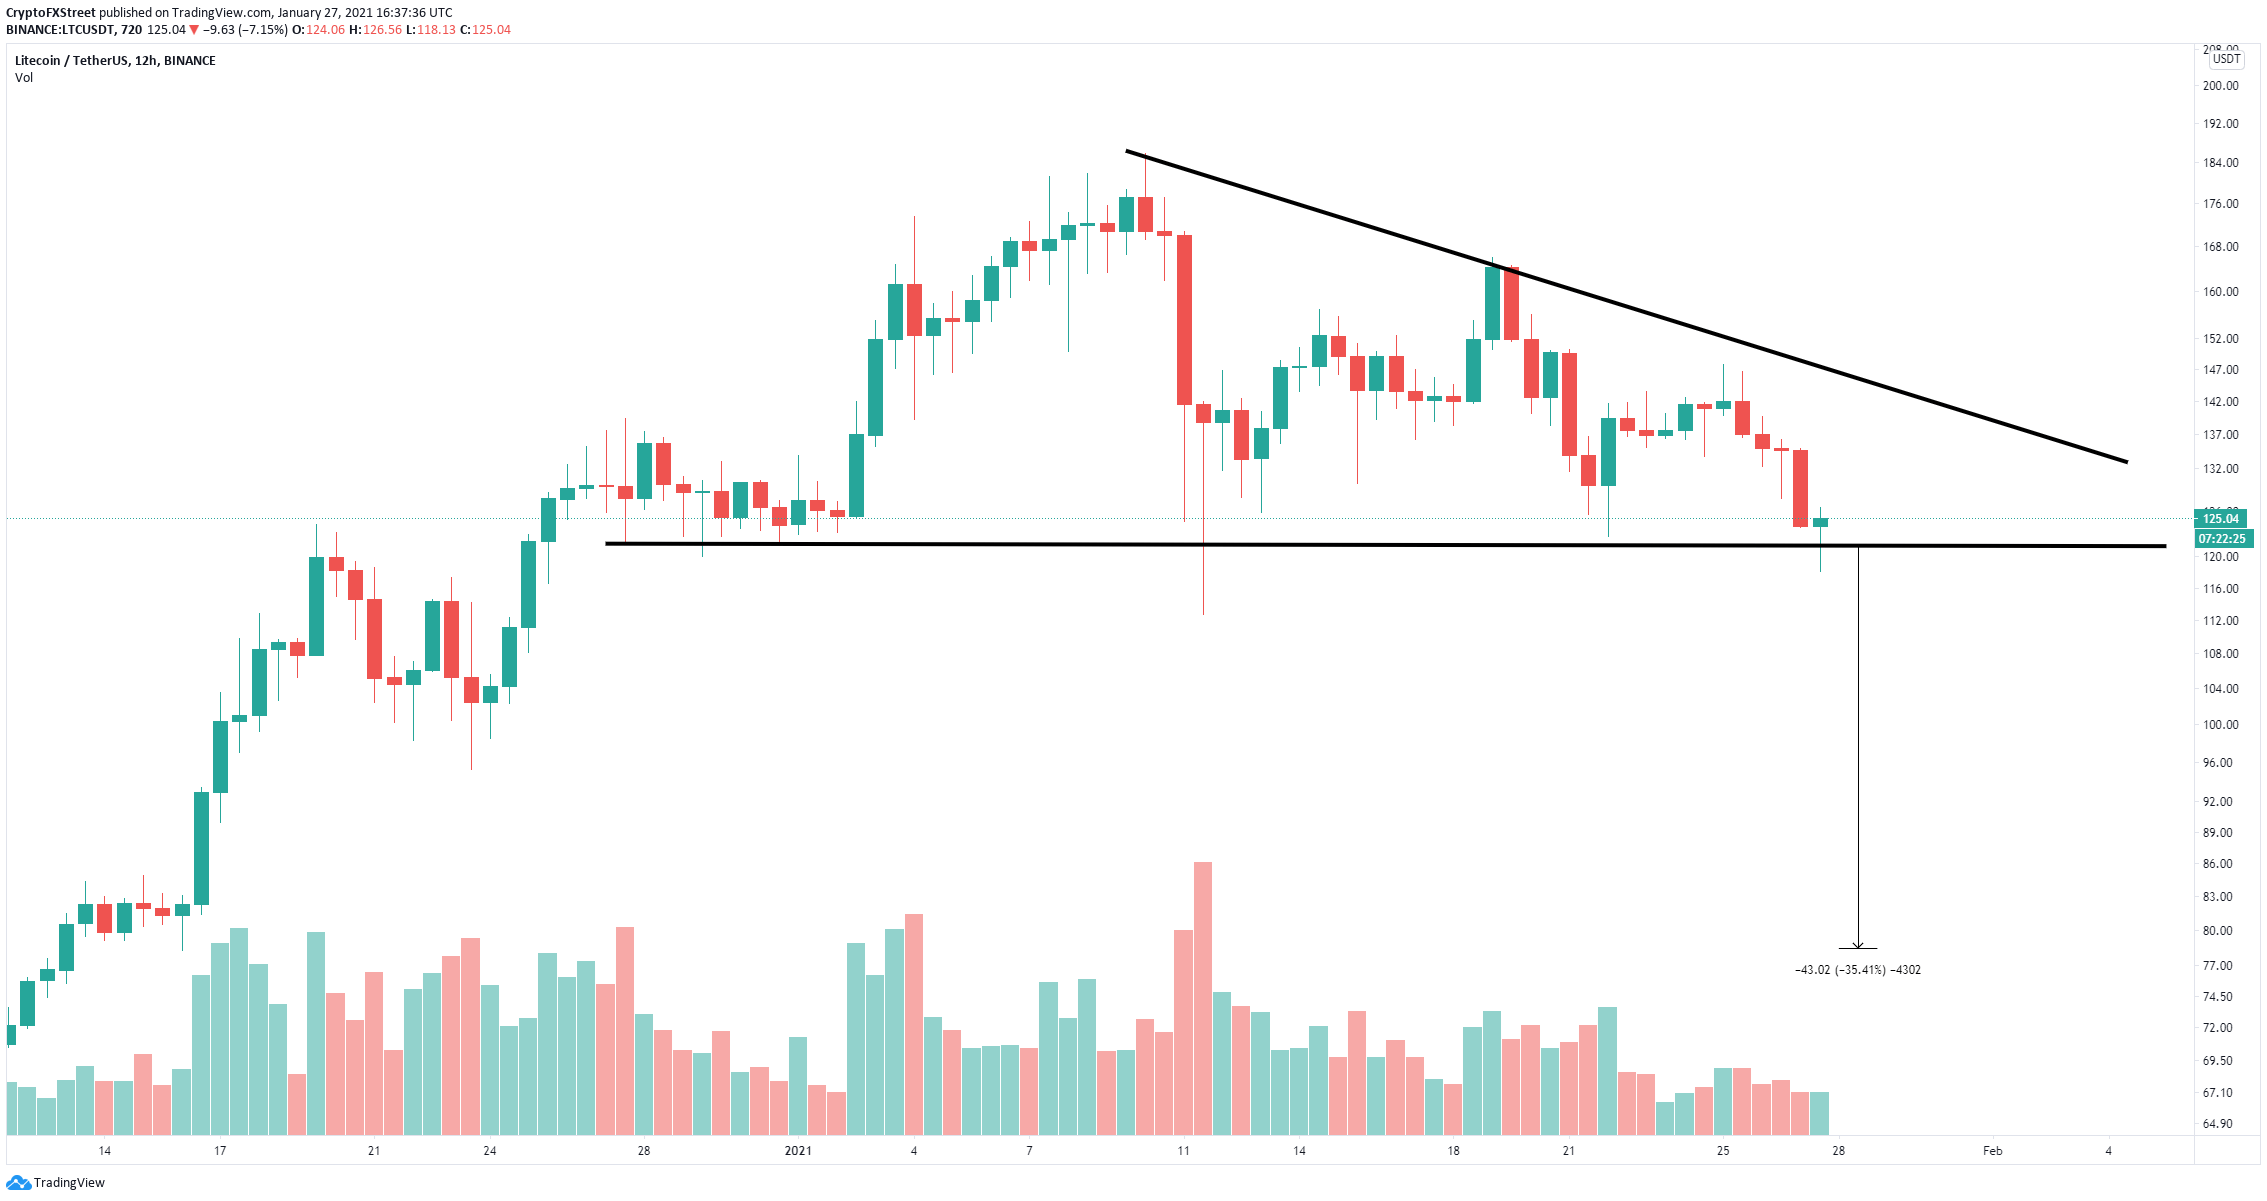
LTC/USD 12-hour chart
The Confluence Detector shows only one robust resistance level at $127 which coincides with the 50-SMA level on the daily chart. On the downside, there is support between $126 and $125.
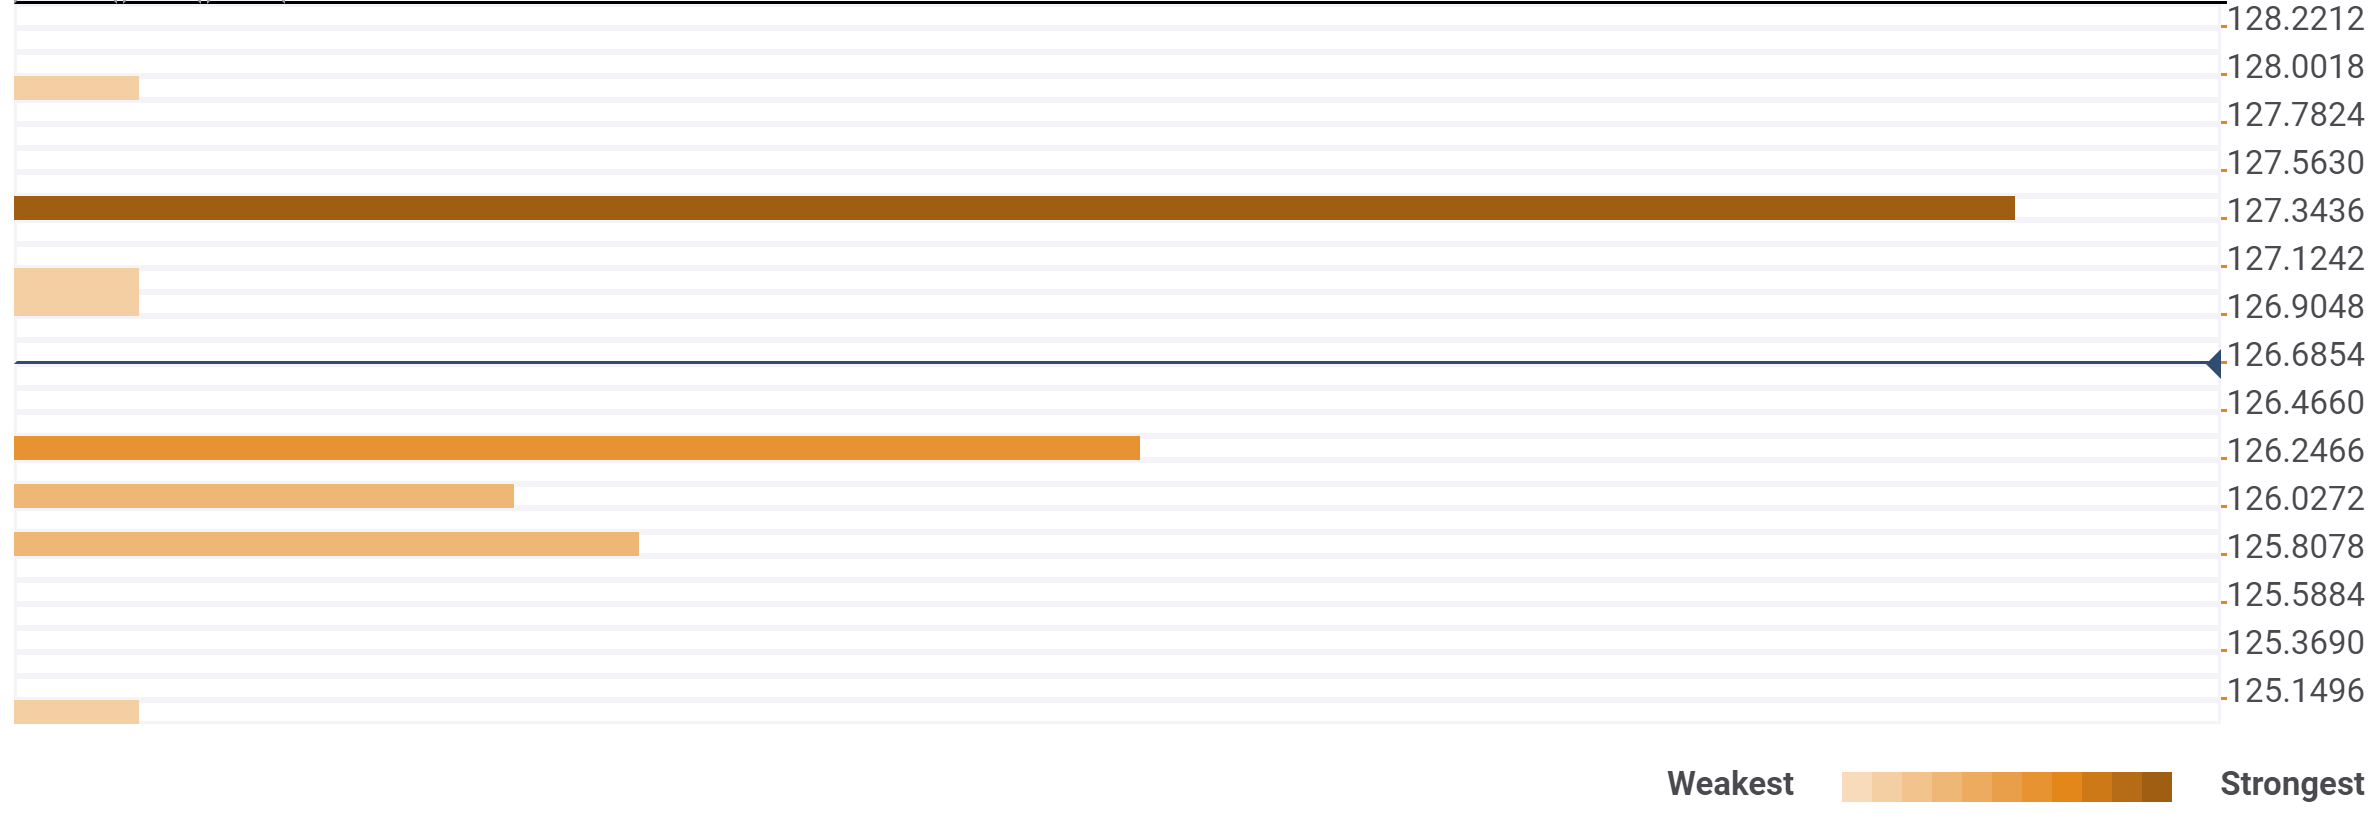
LTC Confluence Levels
These two levels coincide with a previous high on the 4-hour chart, the 10-SMA on the hourly chart, the previous high on the 1-hour chart and finally the previous low in the 15-minutes chart.
Author

Lorenzo Stroe
Independent Analyst
Lorenzo is an experienced Technical Analyst and Content Writer who has been working in the cryptocurrency industry since 2012. He also has a passion for trading.


