Litecoin price analysis: Short term rising wedge, long term falling wedge
- Rising wedge breakout on the verge on the short term chart.
- Falling wedge breakout occurs, pending confirmation on the long term.

Litecoin the cryptocurrency, has a typcial thing to tackle at this moment wherein it has a rising wedge bearish pattern on the short term chart while on the long term there is a falling wedge bullish breakout that has already happened, pending confirmations.
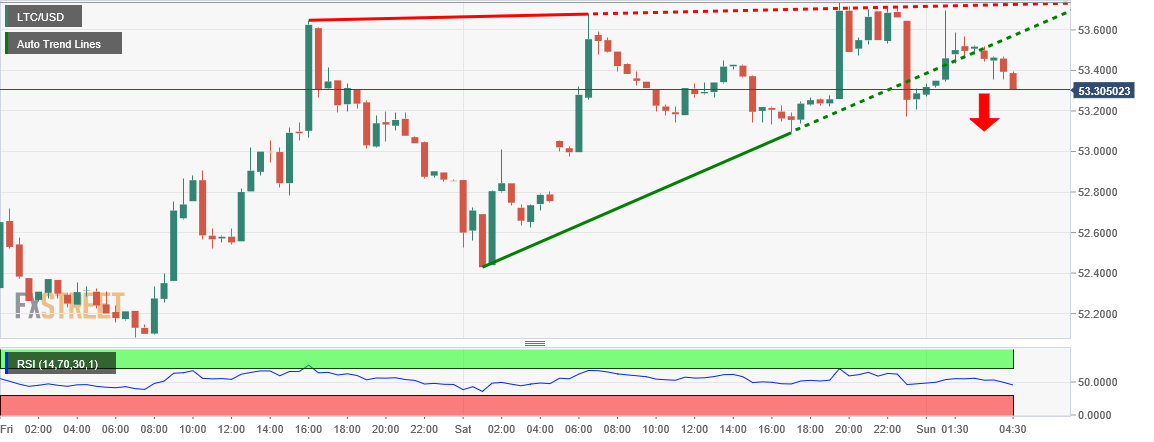
LTC/USD is up one cent of a percent at $53.32 and in less than one percent range in lower volume, lower volatility weekend trading. On the 30-minute chart, there is a rising wedge bearish breakdown which would be confirmed once it breaks down below $53.10, targetting $51 at the least.
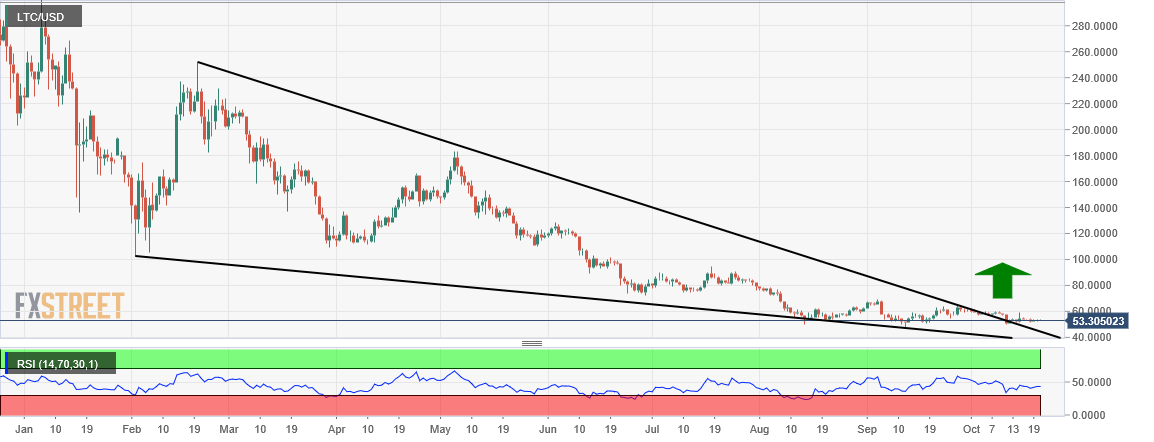
On the other hand there is a bullish falling wedge breakout that has occured on the daily chart, which still has a confirmation pending, which needs LTC to cross past $65-$70 range, once done this would result in prices rallying all the way towards $200.
LTC/USD 30-minute chart:
LTC/USD daily chart:
Get 24/7 Crypto updates in our social media channels: Give us a follow at @FXSCrypto and our FXStreet Crypto Trading Telegram channel
Author

Manoj B Rawal
Independent Analyst
Manoj B Rawal, financial markets professional with about 11 years of experience in writing, editing and advising on stocks, currencies and fixed income.


