Litecoin price analysis: LTC/USD bulls target at $50.00
- Litecoin retreats from the recent high.
- The critical resistance is created by $50.00.

Litecoin, now the 6th largest digital asset with the current market value of $2.9 billion, is changing hands at $45.38, off the intraday high registered at $46.18. Litecoin has gained about 1.3% in recent 24 hours and stayed mostly unchanged since the beginning of Tuesday. The coin has been moving in sync with the rest of the market, consolidating gains.
What's going on
The news that BitGo, a provider of multi-signature wallets solutions will become a custodian for Litecoin Foundation, created positive vibes around the coin; however, the upside momentum was mostly attributed by speculative and technical factors.
Read more details about Litecoin's partnership with Bitgo
In a separate development, Litecoin Foundation confirmed that it was working on privacy features announced at the beginning of 2019. The team hired Grin developer David Burkett to work on code.
LTC/USD: technical picture
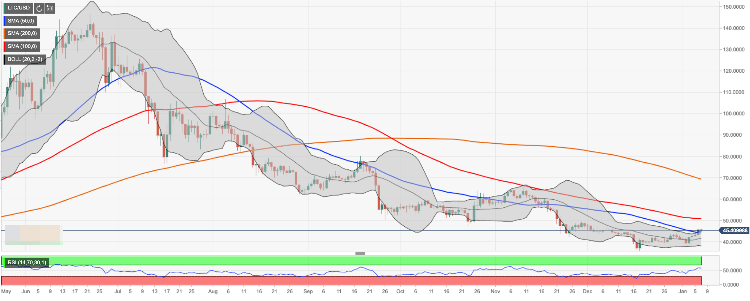
LTC/USD is moving within a short-term rising channel with the upper boundary created by the upper line of 4-hour Bollinger Band at $49.00 and the support area created by SMA50 (Simple Moving Average) daily and the middle line of 4-hour Bollinger Band on approach to $44.00. A sustainable move in either direction will create strong momentum and allow for further direction move.
On the upside, the recent high of $46.18 may serve as an initial barrier on the way to the above-said channel resistance. Once it is out of the way, the upside is likely to gain traction with the next focus on psychological $50.00 and $50.80 reinforced by SMA100 (Simple Moving Average) daily. LTC/USD has been trading below this MA since the middle of July 2019, which implies that bulls may have a hard time taking it out.
On the downside, a sustainable move below $44.00 will negate the short0term bullish setup and bring $40.00 back into focus. This support is followed by the lowest level of 2020 at $38.76 and the lower line of the daily Bollinger Band at $38.20.
LTC/USD daily chart

Author

Tanya Abrosimova
Independent Analyst


