Litecoin Market Overview: LTC/USD plummets by 7% even as mining hashrate sets a new high
- LTC/USD went down from $84 to $78 this Monday.
- As per BitInfoCharts, Litecoin has recently set a new high in mining hashrate.

LTC/USD went down from $84 to $78 this Monday, plummeting by 7%. Overall market momentum is bearish, and bulls will need to rally together and protect critical support at $75. Technical analysis shows that further downward movement is expected. Despite all this, there is some good news. As per BitInfoCharts, Litecoin has recently set a new high in mining hashrate and a new record number of Lightning nodes. The hashrate peaked at 359.43TH/s on April 8th, edging out the previous high reached 11 months ago at 342.88TH/s.
LTC/USD Daily Chart
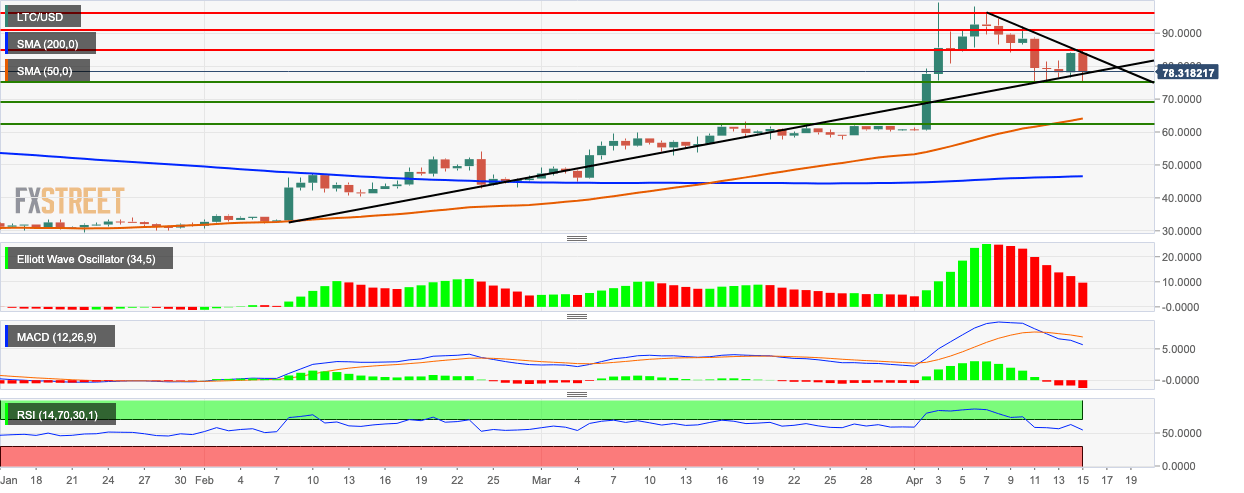
- LTC/USD is ready for a breakout from the triangle formation.
- Despite bearish momentum, the market is trending above both the 50-day simple moving average (SMA 50) and SMA 200 curves.
- Immediate support is at $75 which the bulls will need to protect.
- The Elliot wave oscillator shows eight consecutive bearish sessions, albeit of decreasing intensity.
- The signal line has diverged away from the moving average divergence convergence (MACD) line showing increasing bearish momentum.
- The relative strength index (RSI) has crept into the neutral territory from the overbought zone.
Author

Rajarshi Mitra
Independent Analyst
Rajarshi entered the blockchain space in 2016. He is a blockchain researcher who has worked for Blockgeeks and has done research work for several ICOs. He gets regularly invited to give talks on the blockchain technology and cryptocurrencies.


