Is the Ethereum price on its way back to $2,000?
- Ethereum price has rallied 20% since it’s the late August sell-off.
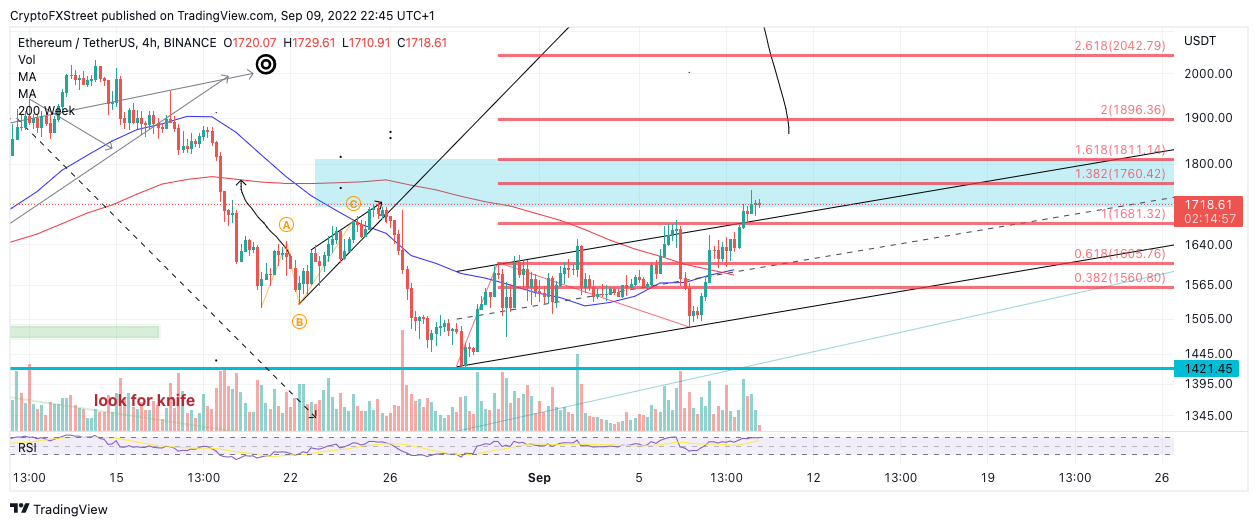
- ETH price has breached both the 8-day exponential and 21-day simple moving averages while a golden cross has taken place.
- Invalidation of the bearish thesis is a breach below $,1422.

Ethereum price shows retaliation signals that could lead to a much stronger rally than expected.
Ethereum price could rally higher
Ethereum price currently auctions at $1,699 as a profit taking consolidation occurs near the recently breached $1,700 zone. Since the June august 28 low at $1,422 the smart contract token has rallied 20%. When diving into the technicals, there is underlying bullish strength that suggests bulls in the market are wont be letting go of their positions until higher targets are reached.
Ethereum price shows a very subtle bullish divergence between August 22nf when prices bottomed near $1,540 and the the August low at $1,422. Additionally amidst the current uptrend move the bulls have breached through both the 8-day exponential and 21-day simple moving averages. Now as price consolidates above an ascending trend channel from the (surrounding the first spike and the last pullback prior to the rally) the moving indicators have produced a golden cross signal.
ETH USDT 4-Hour Chart
When combining these factors a continuation of the bullish uptrend should not be ruled off the table. A Fibonacci projection tool surrounding the first spike and final pullback prior to the rally has a 161.8% FIb level in the $1800 zone. If the bulls can maintain support above the ascending trend channel a spike towards ,1800 and potentially $2,040 at the 261.8% Fib level could occur.
Invalidation of the uptrend thesis is contingent upon $1422 remaining unswept amidst future price action. Early evidence of uptrend failure could be breach of the first swing high prior to the current rally at $1,605.
In the following video, our analysts deep dive into the price action of Ethereum, analyzing key levels of interest in the market. -FXStreet Team.
Author

Tony M.
FXStreet Contributor
Tony Montpeirous began investing in cryptocurrencies in 2017. His trading style incorporates Elliot Wave, Auction Market Theory, Fibonacci and price action as the cornerstone of his technical analysis.


