Top 3 Price Prediction Bitcoin, Ethereum, Ripple: Shakeouts, Fakeouts, Hopes & Dreams pt.3
- Bitcoin price rebounds with an uptick in volume after falling below $19,000 for the first time since July.
- Ethereum price shows more investors are currently in profit than at a loss, which could reduce overall selling pressure.
- XRP price produces the largest pullback within the wedging downtrend.

Since crypto’s inception, September has persistently been bearish, yielding negative returns. Nonetheless, there are technical and on-chain metrics suggesting September of 2022 could tell a different story.
Bitcoin price setting for a rebound?
Bitcoin price currently auctions at $19,284 as the bulls are producing a rebound after Bitcoin's recent breach of $19,000. On September 6, the peer-to-peer original crypto token fell beneath the psychological barrier for the first time since July 3 and consequently enabled the bears to forge a daily close at $18,667.
Santiment's Volume Profile Indicator shows an uptick in volume near the newly established low. At slightly over $43 billion worth of transactions, the $18,667 has $1 billion more transactions than the June 18 low at $17,593, which had $42 billion. This is an anomalous signal as the June 18 low became pivotal on the summertime floor, providing support before a 40% rally occurred.
 [09.06.48, 08 Sep, 2022]-637982561166763172.png)
Santiment’s Price & Volume Indicators
Is smart money pulling a fast one?
A rebound could occur in the coming days. Key levels of interest are a 38.2% Fibonacci level at $21,850. The FIB level is derived from the 2020 lows of $3,850 to the 2021 swing highs at $69,000. Additionally, the 200-week moving average is currently positioned at $23,040. This gives BTC aviation space up to 20%.
Invalidation of the bullish thesis will be a breach below the June 18 swing low at $17,592. Traders should also wait for a confirmation signal, such as a bullish cross of moving averages or a definitive daily close over $20,450 for a safer entry to a highly risky countertrend idea.
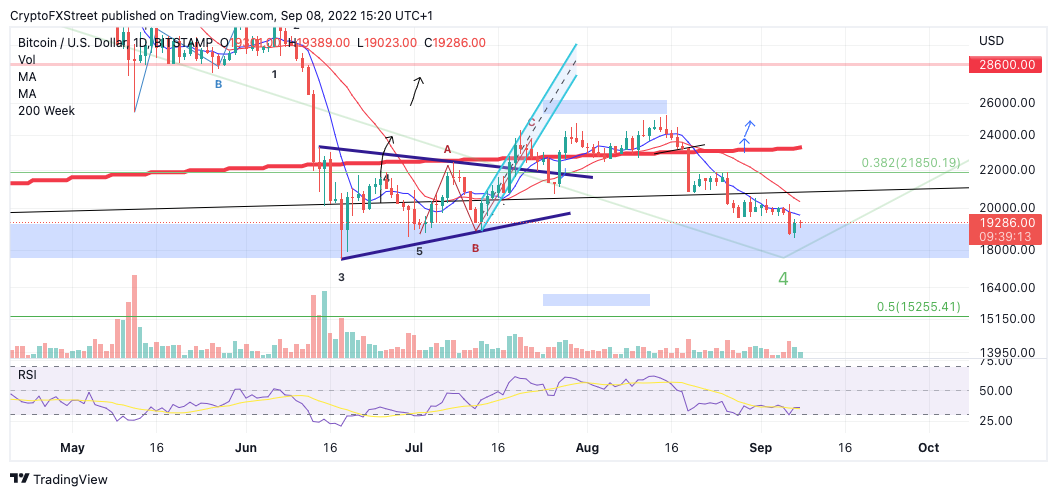
BTC USDT 3-Day Chart
In the following video, our analysts deep dive into the price action of Bitcoin, analyzing key levels of interest in the market. -FXStreet Team
Ethereum price has potential
Ethereum price currently auctions at $1,634 as the bulls have rebounded from the crypto downslide experienced on September 6. The bulls managed to print a 2-day doji candle with relatively low volume, suggesting there are still bulls in the market anticipating higher prices. Additionally, the settlement at $1,630 was established above the colliding 8- and 21-day simple moving averages.
Into theblock's In/Out of the Money indicator confounds the idea that the Ethereum price could rally higher. According to the indicator, about 47 million addressed are currently in the money, meaning they bought in at an average price lower than the current market value. The indicator shows the next significant selling pressure could arise near $1,900, where nearly 6.74 million addresses are out of the money, having bought the Ethereum price with an average price of $1,936.
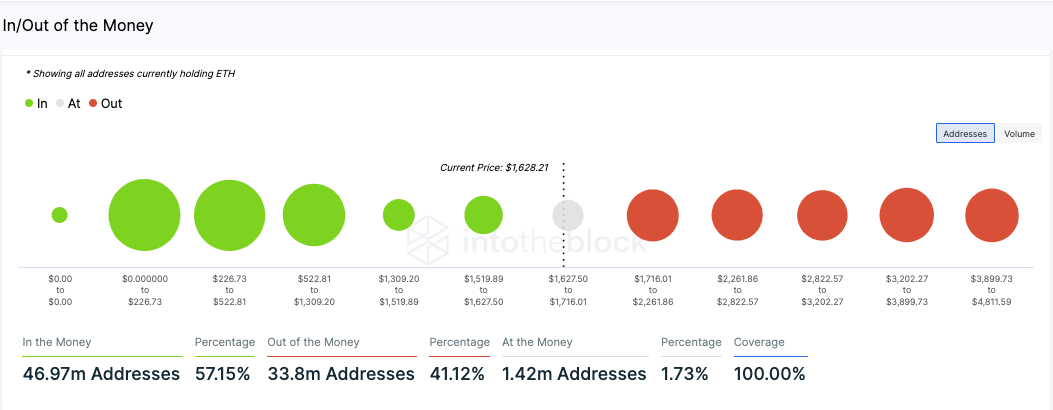
Into the Block’s In/Out of the Money Indicator
In theory, the indicator suggests fewer investors in the market are feeling the pressure to break even. This subtle bullish cue could enable a continuation of the summertime uptrend. If the bulls can hurdle the $1,900 resistance, the $2,200 zone will be the next key level of interest, providing 30% of potential gains from the current Ethereum price.
Combining these factors, a short-term pullback should not be ruled out for the decentralized smart contract token. A close above $1,735 could be the catalyst to induce the bullish move. Invalidation of the bullish thesis, however, depends on $1,250 remaining unbreached.
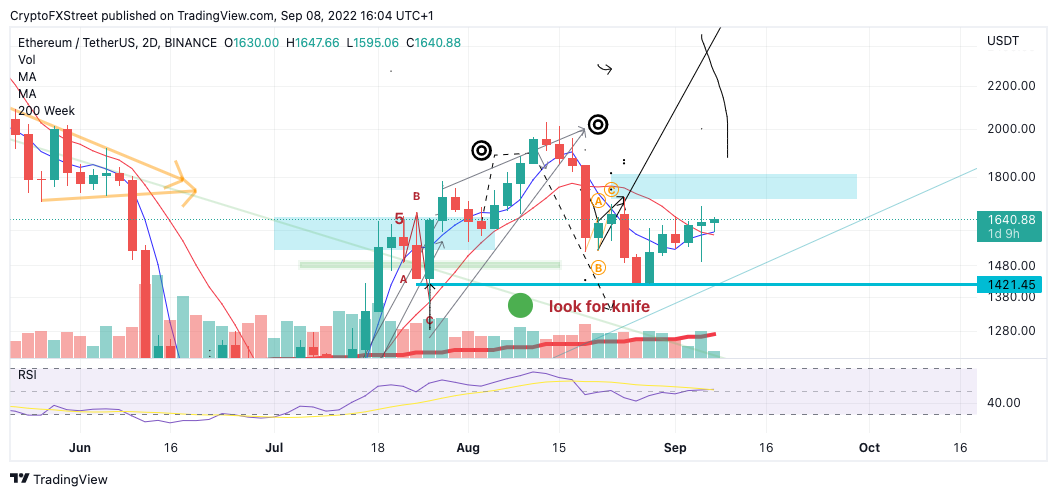
ETH USDT 3-Day Chart
In the following video, our analysts deep dive into the price action of Ethereum, analyzing key levels of interest in the market. -FXStreet Team.
Ripple price can rebound higher
Ripple's XRP price could make a case for a more countertrend pullback. Since the final days of July, the digital remittance token continues to descend in wedging-like formation. Amongst chart pattern traders, the wedge could be a gesture of a weakening downtrend.
On September 7, the XRP price produced a strong rebound since breaching the $0.31 barrier earlier in the week. The current 5% pullback is the largest retracement within the wedge relative to each decline prior.
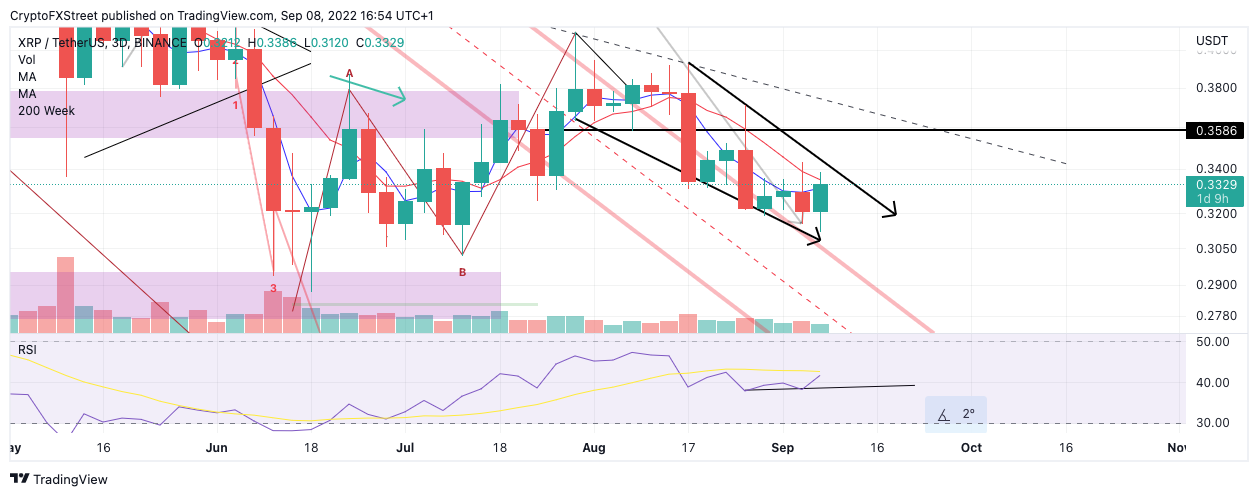
XRP USDT 3-Day Chart
Ripple's XRP price currently auctions at $0.33. The Relative Strength Index shows subtle bullish divergence on the 3-day chart, which may be an overlooked cue amongst the traders using smaller timeframes. Additionally, the 8-day exponential and 21-day simple moving Averages collide near the current price action.
If the bulls can produce a 3-day candle close above the colliding indicators, an additional rally to $0.36 could occur. Such a move would result in a 10% rebound from the current XRP price.
In the following video, our analysts deep dive into the price action of Ripple, analyzing key levels of interest in the market. -FXStreet Team
Author

Tony M.
FXStreet Contributor
Tony Montpeirous began investing in cryptocurrencies in 2017. His trading style incorporates Elliot Wave, Auction Market Theory, Fibonacci and price action as the cornerstone of his technical analysis.


