IOTA price could have reached a local top after rising more than 150%
- IOTA taps into the decentralized Oracles solutions triggering massive buy orders.
- Oracles bridge the gap between the digital world and the physical world.
- The uptrend will be sustained if IOTA settles above the resistance at $1.4, allowing bulls to focus on higher highs.

IOTA spiked spectacularly after breaking above August 2020 resistance at $0.45. A new yearly high was formed at $1.4, marking a possible local top. Note that IOTA is still a long way to its all-time high of $6.5. However, investors seem to be selling the news as technical flip bearish.
IOTA eyes the decentralized Oracles solutions space
IOTA recently announced that it would tap into the Oracles niche by providing a unique and secure bridge between the digital and the physical worlds in a decentralized and permissionless manner. In other words, Oracles are used to furnish blockchains with information from the outside world, which is utilized in smart contracts or perhaps offers interoperability among distributed ledgers.
In the same way, IOTA Oracles are designed to “bring off-chain data to decentralized applications and smart contracts on the IOTA network.” For instance, the First Party Oracles uses the issuer (sensors) data to ensure no data is manipulated or reformatted by outside forces.
IOTA retraces as investors sell the news
The above news caused a stir in the crypto community as investors rushed to get a piece of the cake and capitalized on the upswing. However, the fear of missing out (FOMO) seems to have reached its elastic limit, and a correction is coming into the picture.
IOTA is trading at $1.13 at the time of writing amid an ongoing trend reversal. The Relative Strength Index (RSI) on the daily chart is oversold, suggesting that a retreat is long overdue. A comprehensive look at the chart does not reveal any vivid support areas apart from the 50-day Simple Moving Average at $0.45. The 100 SMA and 200 SMA will absorb the selling pressure and perhaps avoid losses toward $0.3.
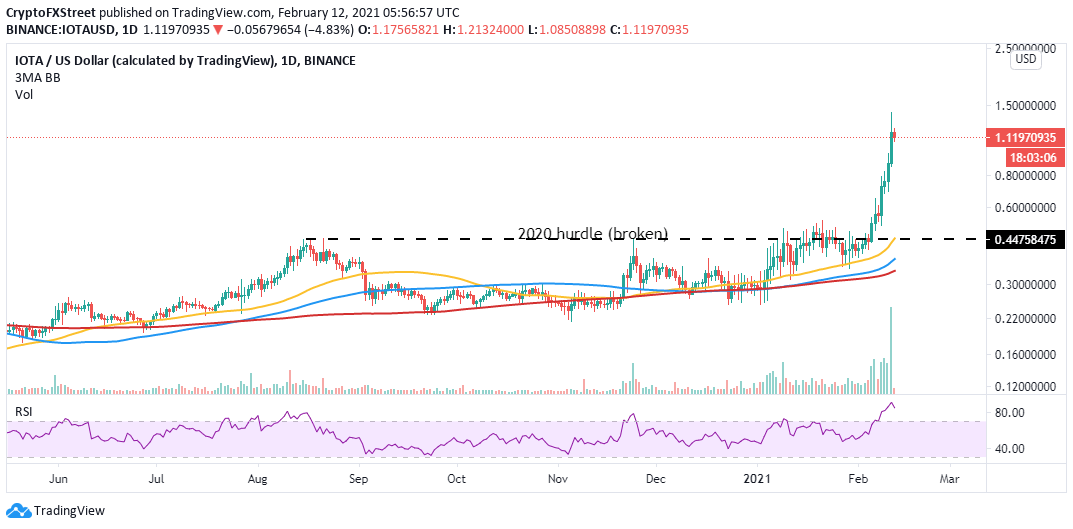
IOT/USD daily chart
IOTA has likely reached a local top and is about to retreat, mostly when the TD Sequential Indicator is observed. A sell signal presented on the 4-hour hints at a potential reversal. Note that the last three sell signals were confirmed, leading to between 8% and 14% corrections.
Therefore, if history repeats, we could see IOTA breaking down towards $1. Simultaneously, this drop could be significant because investors are believed to have bought the news.
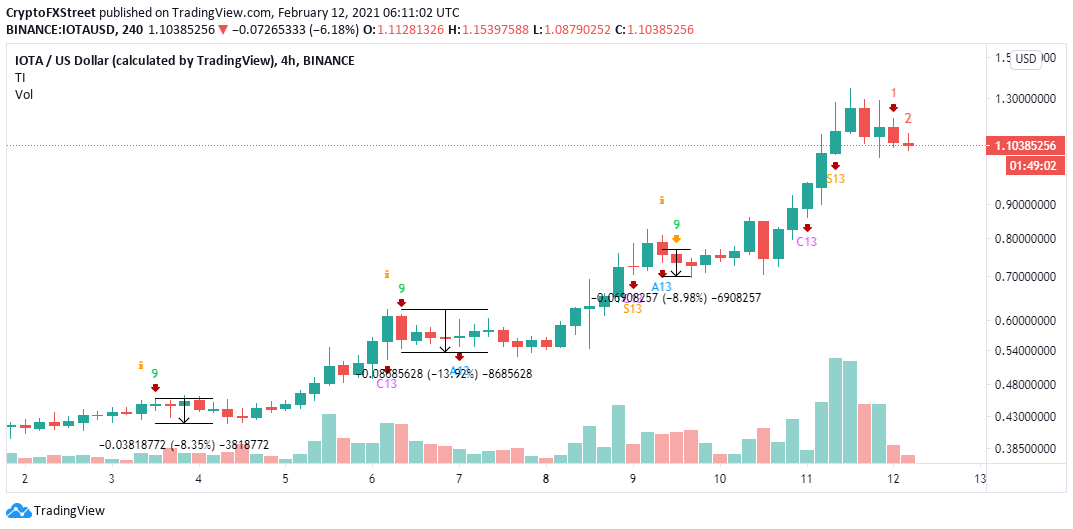
IOT/USD 4-hour chart
Looking at the other side of the fence
The majority of cryptocurrencies have hit new all-time highs in the ongoing bull run. However, IOTA is trading significantly below its $6.5 record high. Investors could ignore the overbought conditions and push above the near term resistance at $1.4.
Trading above this level is likely to trigger more buy orders while improving investor confidence in its ability to close in on the record highs.
Author

John Isige
FXStreet
John Isige is a seasoned cryptocurrency journalist and markets analyst committed to delivering high-quality, actionable insights tailored to traders, investors, and crypto enthusiasts. He enjoys deep dives into emerging Web3 tren