Hedera Hashgraph could erase its bullish pattern as dark clouds overshadow the price action
- Hedera Hashgraph price has defaulted on its bullish pattern.
- HBAR has already retraced from the top support to the medium support.
- Expect a full unwind to the low support with a nearly 27% decline.

Hedera Hashgraph (HBAR) was in the graces of investors and bulls as a clear pattern was spotted at the beginning of February. Each time an ascending trend line underpinned the price action before a breakout trade, HBAR moved higher and formed an ascending trend line again. As two trend lines were broken already, it looks inevitable that the last and initial trend line is set to be tested soon.
Hedera Hashgraph sees bears abusing the bullish pattern for their siege
Hedera Hashgraph price already tanked 35% from peak to where price action is residing this Monday. Along the way two purple ascending trend lines got broken and saw an extensive bearish move as sellers used the breakout to flood the market with sell offers. As the rally unwinds further, only one ascending trend line remains to be tested.
HBAR needs traders to gear up for at least a 27% decline to come alongside two intermediary forces that could try and slow down this decline. First, the 200-day Simple Moving Average (SMA) near $0.06 could be price supportive. Second, the monthly S1 support at $0.055 adds to strength. Do not expect those to be strong enough to really stop the decline and rather look for $0.045 to be the sandbox where this decline gets halted from making any more lows.
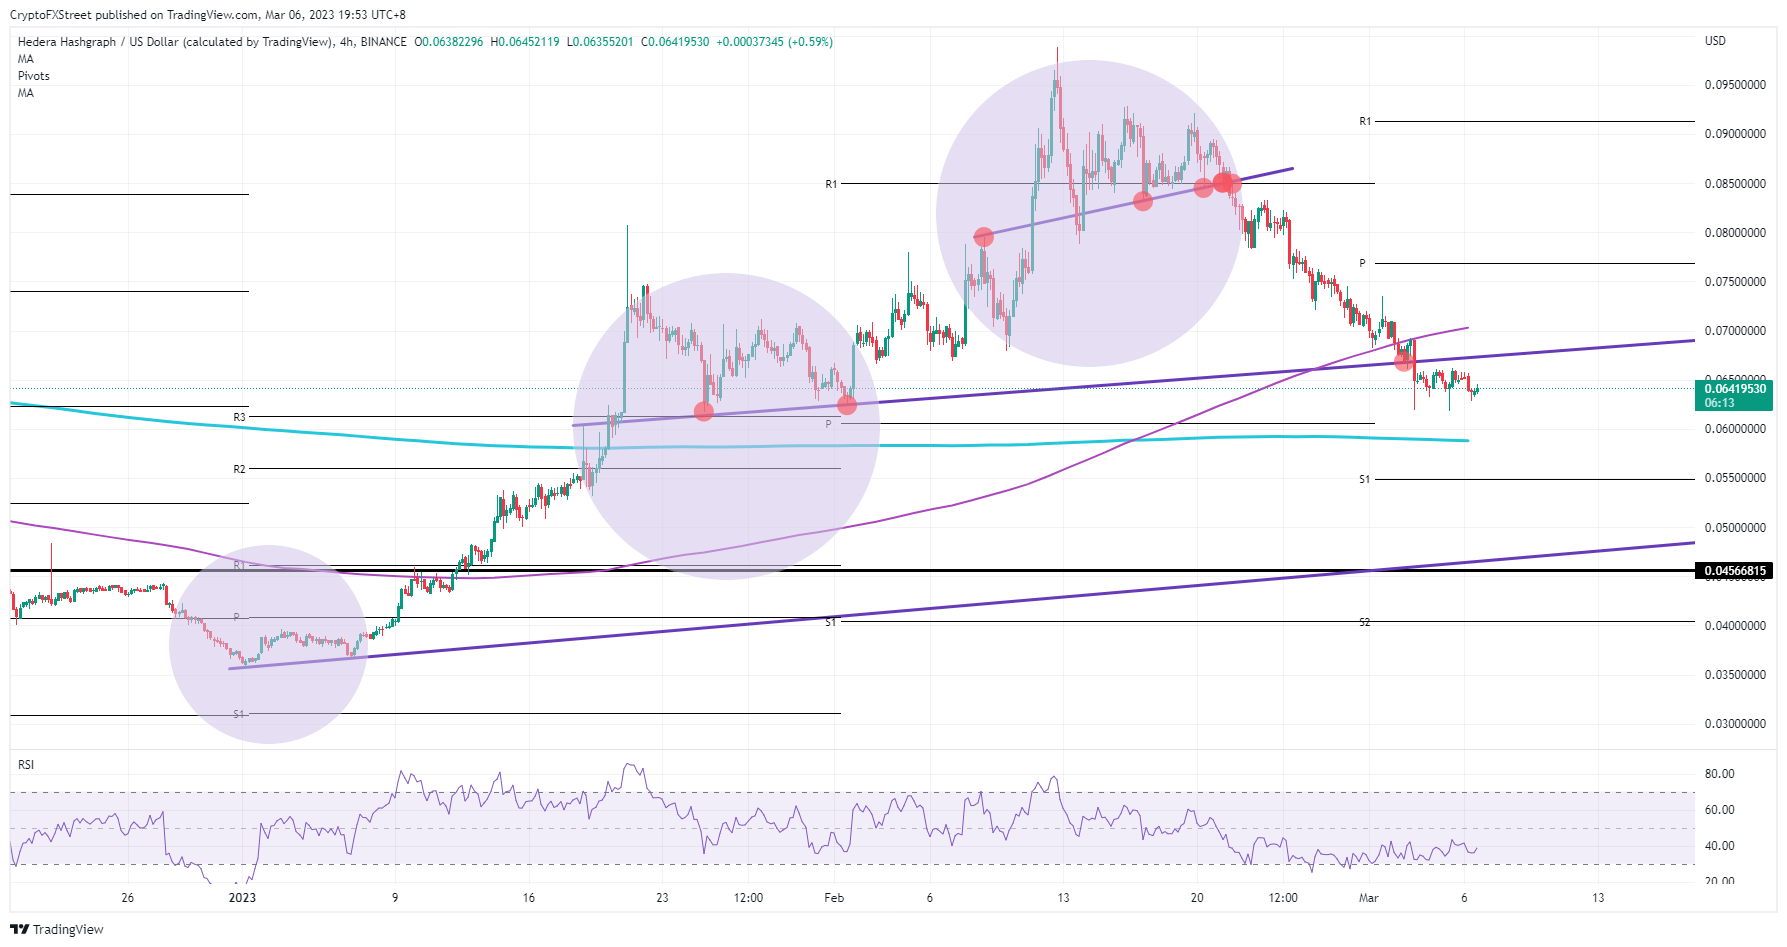
HBAR/USD 4H-chart
Should bulls be able to push price action back above the purple ascending trend line at $0.07, a turnaround could be in the works. The Relative Strength Index (RSI) would support such a turnaround as it is rather near the oversold area. Room for upside could be seen near $0.07 and $0.075 with the 55-day SMA and the monthly pivot as the best target points for some short-term profit.
Author

Filip Lagaart
FXStreet
Filip Lagaart is a former sales/trader with over 15 years of financial markets expertise under its belt.


