Hedera Hashgraph Price Prediction: HBAR points south but the macro setup suggests otherwise
- The winter rally, which rose HBAR price 180% since January 1, remains intact amidst bearish price action.
- A decline as low as $0.049 would result in a 30% decrease in market value but could be viewed as a buying opportunity.

Hedera Hashgraph price shows short-term bearish trading within an overall strong uptrend. Traders should keep their eyes on the technicals in search of a market reversal signal.
Hedera Hashgraph price is one to watch
Hedera Hashgraph price confirmed the short-term bearish bias mentioned in previous outlooks, as the scalable smart contract token has declined by 20% in the last nine days. The recent downswing is worth keeping an eye on as it could only be a brief moment before the trend reverses and the strong impulsive winter uptrend continues towards higher targets.
Hedera Hashgraph currently auctions at $0.07. A Fibonacci retracement tool surrounding the 1.8x winter rally still deems the 20% decline as a shallow pullback. It is common for digital assets to retrace at least 38.2% and, at max, 61.8% after a strong impulsive rally occurs.
The Relative Strength Index (RSI) suggests that underlying support is still within reason for the HBAR technicals. The recent 20% decline has brought the RSI back into the median line near neutral. This is a common area for investors to begin adding into their positions, which have already achieved some profit during the previous upswing.
HBAR price is hovering 16% above the first target zone near the 38.2% FIB level at $0.059. A decline toward the 61.8% level at $0.049 would lead to an additional 30% loss from HBAR's current market value. These two levels could be considered buying opportunities as the winter rally may be in the beginning stages of a larger trend targeting the $0.15 and $0.20 zones in the coming months.
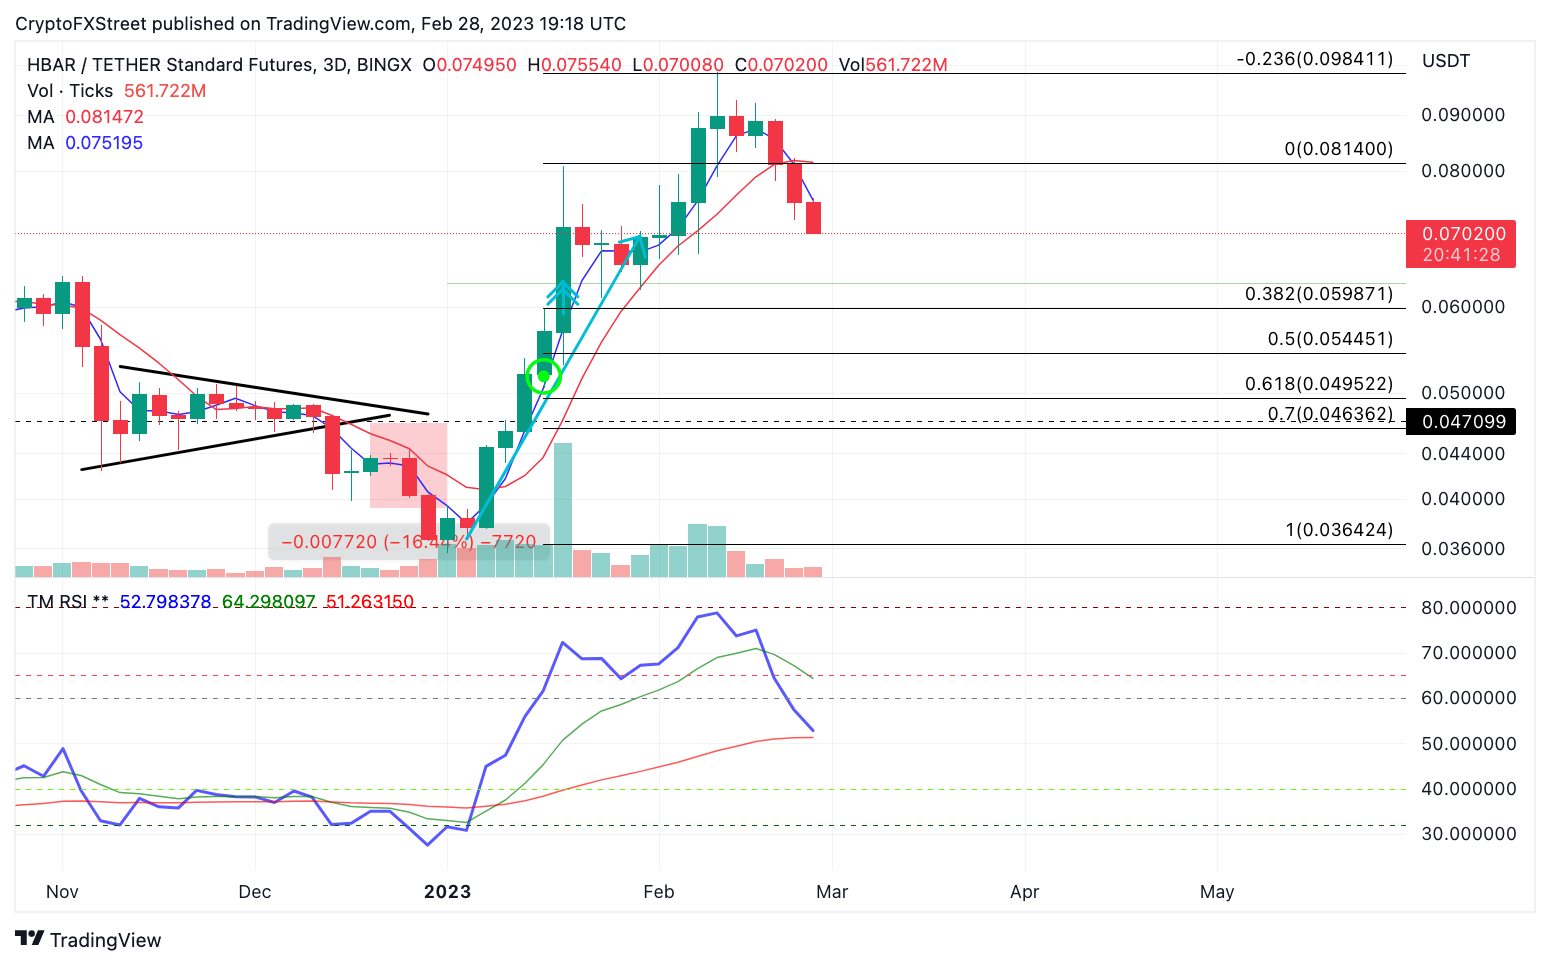
HBAR/USDT 3-day chart
The RSI would need to decline towards under the 40 level, or the HBAR price would need to fall lower than $0.049 to jeopardize the overall uptrend. If either scenario occurs, Hedera could decline as low as in 2022 to $0.035, resulting in a 50% decrease from HBAR current market value.
Author

Tony M.
FXStreet Contributor
Tony Montpeirous began investing in cryptocurrencies in 2017. His trading style incorporates Elliot Wave, Auction Market Theory, Fibonacci and price action as the cornerstone of his technical analysis.


