Ethereum's network activity is booming while ETH price looks poised to breakout
- On-chain metrics show that the number of non-zero Ethereum addresses reached a new all-time high.
- Meanwhile, technical indicators look bullish, targeting a potential upswing to $800.

Ethereum addresses with non-zero balance have just peaked as the hype around the launch of ETH 2.0 seems far from being fully priced in. Confidence among investors remains high, with roughly 1% of all Ether locked in the deposit contract.
The network continues expanding at an exponential rate
The cryptocurrency market seems to be at the early stages of a new bull cycle. Different on-chain metrics have signaled strong positive sentiments around Ethereum based on investors' behavioral patterns. One of them is the number of non-zero addresses on the ETH network.
Data from on-chain metrics firm, Glassnode shows that the number of non-zero Ethereum addresses surpassed the 50 million mark. This number is far from the 8.8 million non-zero addresses recorded in January 2018. At the time, the second-largest cryptocurrency by market capitalization was priced at $1,360.
Such market behavior suggests that there is plenty of room for Ethereum price to advance further.
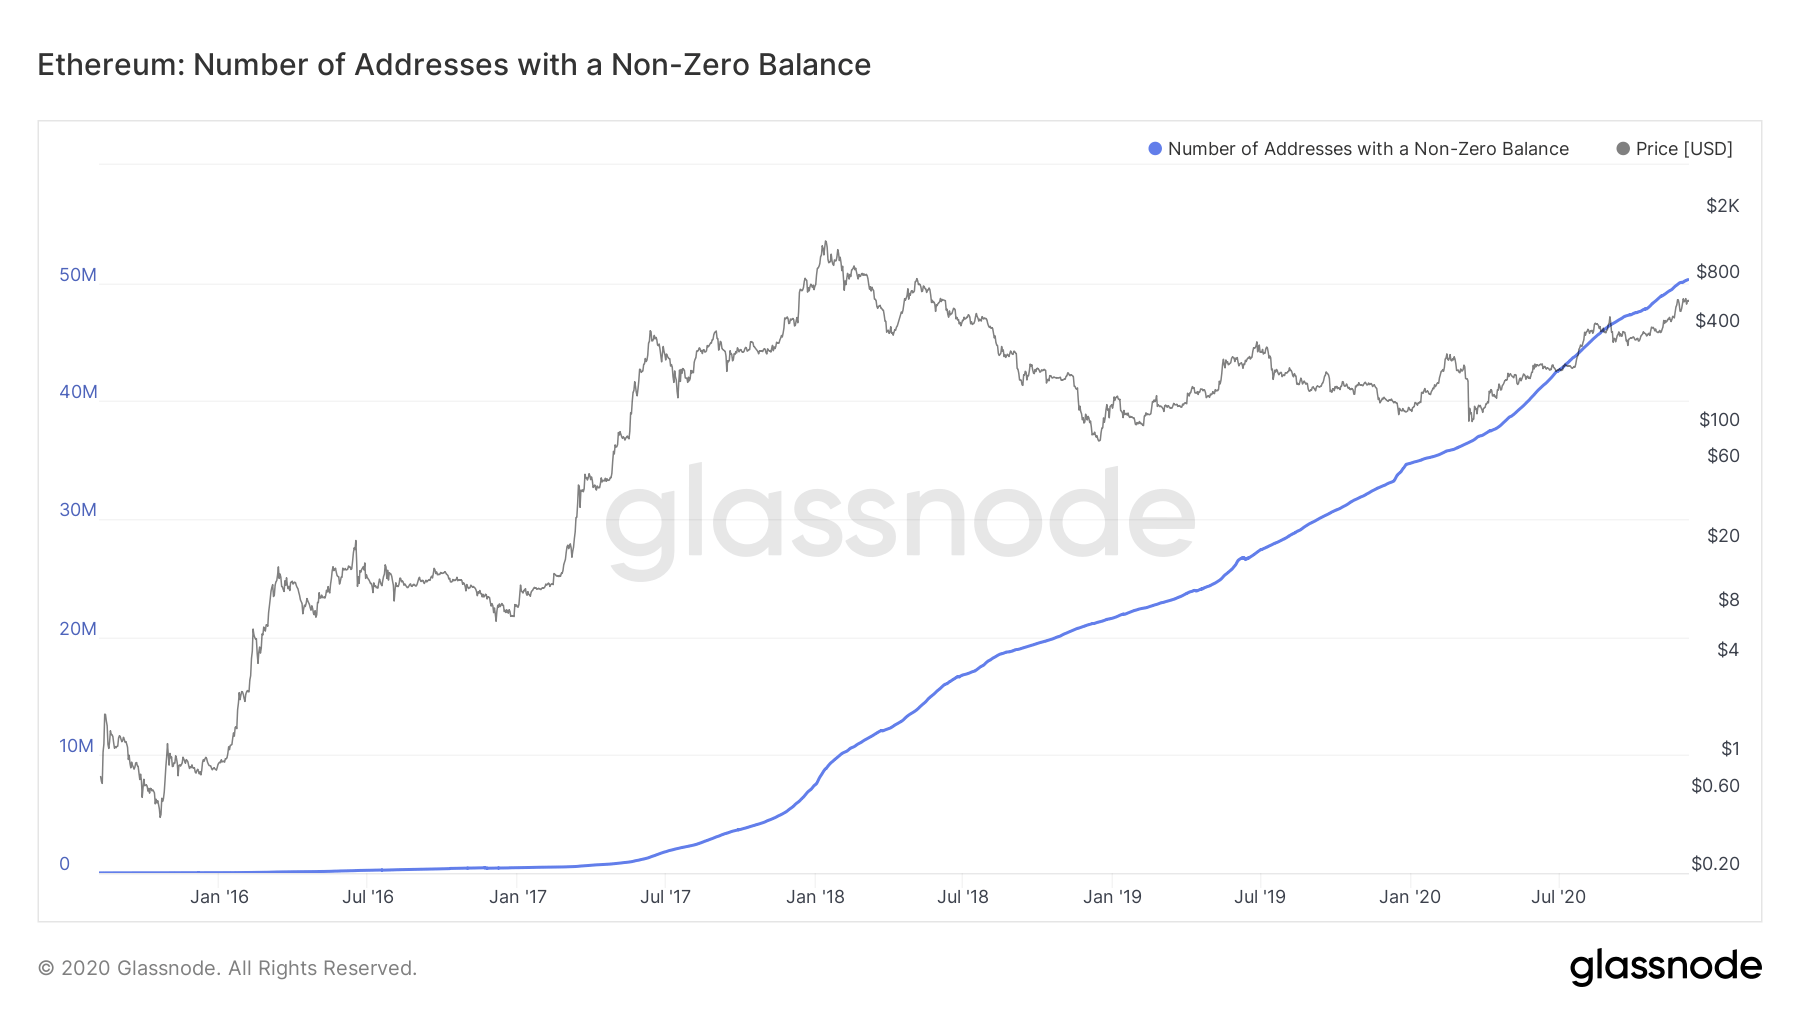
Non-Zero Balance Addresses from Glassnode
The recent spike in network growth can be attributed to the Beacon Chain's launch. According to Vitalik Buterin, Ethereum's founder, approximately 1% of the total Ether supply has been sent ETH 2.0's deposit contract. This
development shows the community's enthusiasm for the proof-of-stake network.
1% of all ETH is now in the deposit contract!
— vitalik.eth (@VitalikButerin) December 6, 2020
Updated stats; the decentralization numbers are a bit worse than last time but only because they now properly treat Bitcoin Suisse with their multiple addresses as a single unit. Still doing far better than I expected! pic.twitter.com/B0ck5YGTUk
Despite the hype around ETH 2.0, the smart contracts token's buying pressure has yet to be manifested.
Ethereum price shows ambiguity
Ethereum price continues consolidating within a tight range that is getting narrower as time goes by. Over the past few days, the price action led to the formation of an ascending triangle within the daily chart.
An increase in buy orders could allow Ether to slice through the overhead resistance at $625, pushing prices up 27% towards $800.
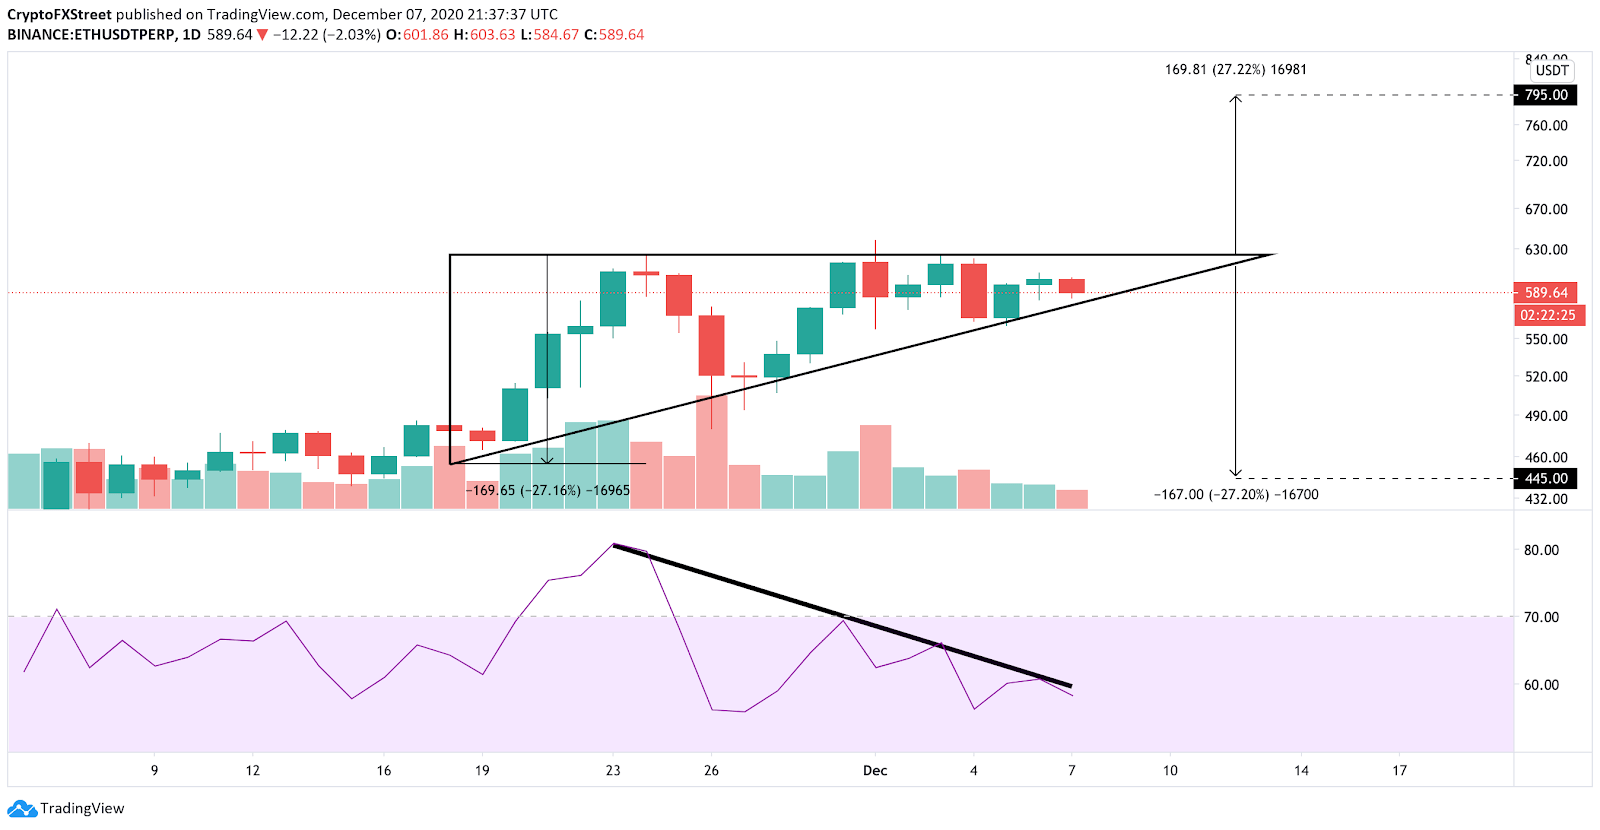
ETH/USDT Daily chart
It is worth noting that the Relative Strength Index (RSI) has been making a series of lower highs over the past two weeks, forming a bearish divergence against Ethereum price. This is a concerning sign as it shows that the uptrend may have reached exhaustion.
For this reason, it is imperative to pay close attention to the triangle's hypotenuse at $570. Moving past this support barrier will likely invalidate the bullish outlook and lead to a steep decline to $450.
Author

FXStreet Team
FXStreet
Composed of a group of economic journalists and FX experts, the FXStreet content team produces and oversees all content published on FXStreet. It provides a purely journalistic approach to the Forex market.



