Ethereum Price Analysis: On-chain data bodes well for ETH bulls
- ETH/USD is positioned for a healthy recovery with the first resistance at $400.
- A sell-off below $350 will darken the short-term technical picture.

Ethereum (ETH) has been losing ground since the start of the week. However, a combination of technical and on-chain data suggests that the second-biggest cryptocurrency by market value is ready for another bullish leg.
At the time of writing, ETH/USD is changing hands at $361, down nearly 4% on a day-to-day basis. The coin hit the highest level of 2020 at $488 on September 1 and crashed to $307 by September 5, effectively losing over 34% in less than five days. Despite the recovery from the recent lows, the coin struggles to gain bullish momentum to get outside the current consolidation range.
While market participants may feel discouraged by sluggish recovery, different technical and on-chain metrics suggest that the situation is about to change for the better.
What happened with ETH
At least three triggers might have knocked Ethereum down from the recent top to the lowest level in more than a month. First, ETH is positively correlated with BTC. According to Cryptowat.ch resource, the 7-days' Pearson's correlation ratio stays at 0.84, meaning that the two coins are moving in close lockstep. Consequently, when BTC dropped below $11,000 amid massive miners' cash out, ETH followed the lead. Also, the technical picture implied that ETH was ripe for the correction as by that time, the price had been growing steadily for over a month and more than doubled.
Apart from that, a sharp correction on a DeFi market also bodes ill for Ethereum. The overwhelming majority of the over-hyped DeFi projects are built on Ethereum's blockchain. Once the industry started unwinding, traders moved to lock their profits, which increased the selling pressure on ETH.
The lousy patch may be over for ETH
Several on-chain metrics and technical indicators imply that the worst may be over for ETH. The coin supply on the cryptocurrency exchanges decreased, sending another bullish signal to the market. It means that traders have less intend to sell them and tend to accumulate them in cold wallets other than in the trading platforms' hot wallets.
Ethereum supply on the exchanges
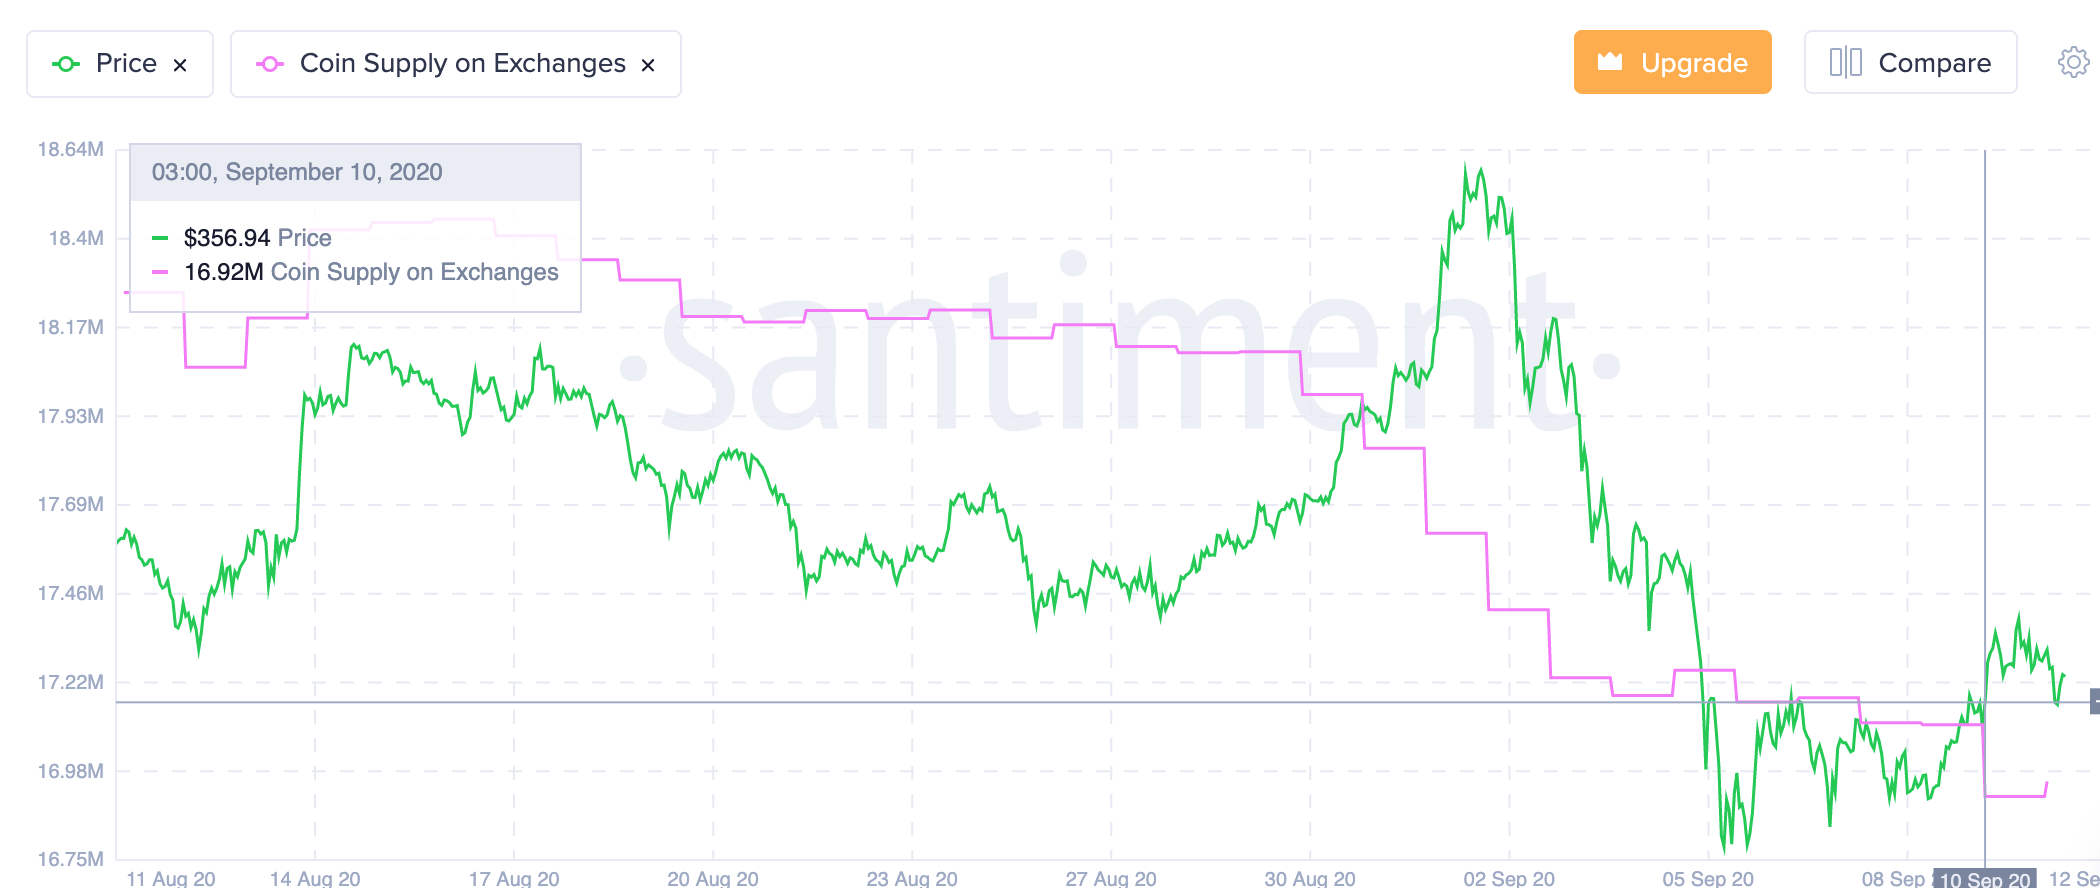
Source: Santiment
The increased ETH outflows from major centralized exchanges support these stats and imply that traders take their money away from trading accounts.
Apart from that, Intotheblock reports that the total number of Ethereum addresses with balances surpassed 46 million, having increased by over 12 million in less than nine months since the start of the year. Simultaneously, the address count tends to move only upwards, its acceleration that matters.
Moreover, In/Out of the Money data shows that the price passed a stiff resistance at $340-$350, and over 257k addresses holding over 8.5 million ETH moved into a green zone. Now that this barrier has turned into a support, the price can recover to $380 with the supply wall of over 2.8 million ETH. Once this barrier is out of the way, the upside momentum will gain traction and push the price towards the next local resistance of $400-$407 with another 3.85 million coins waiting for their breakeven point.
Ethereum's In/Out of the Money data
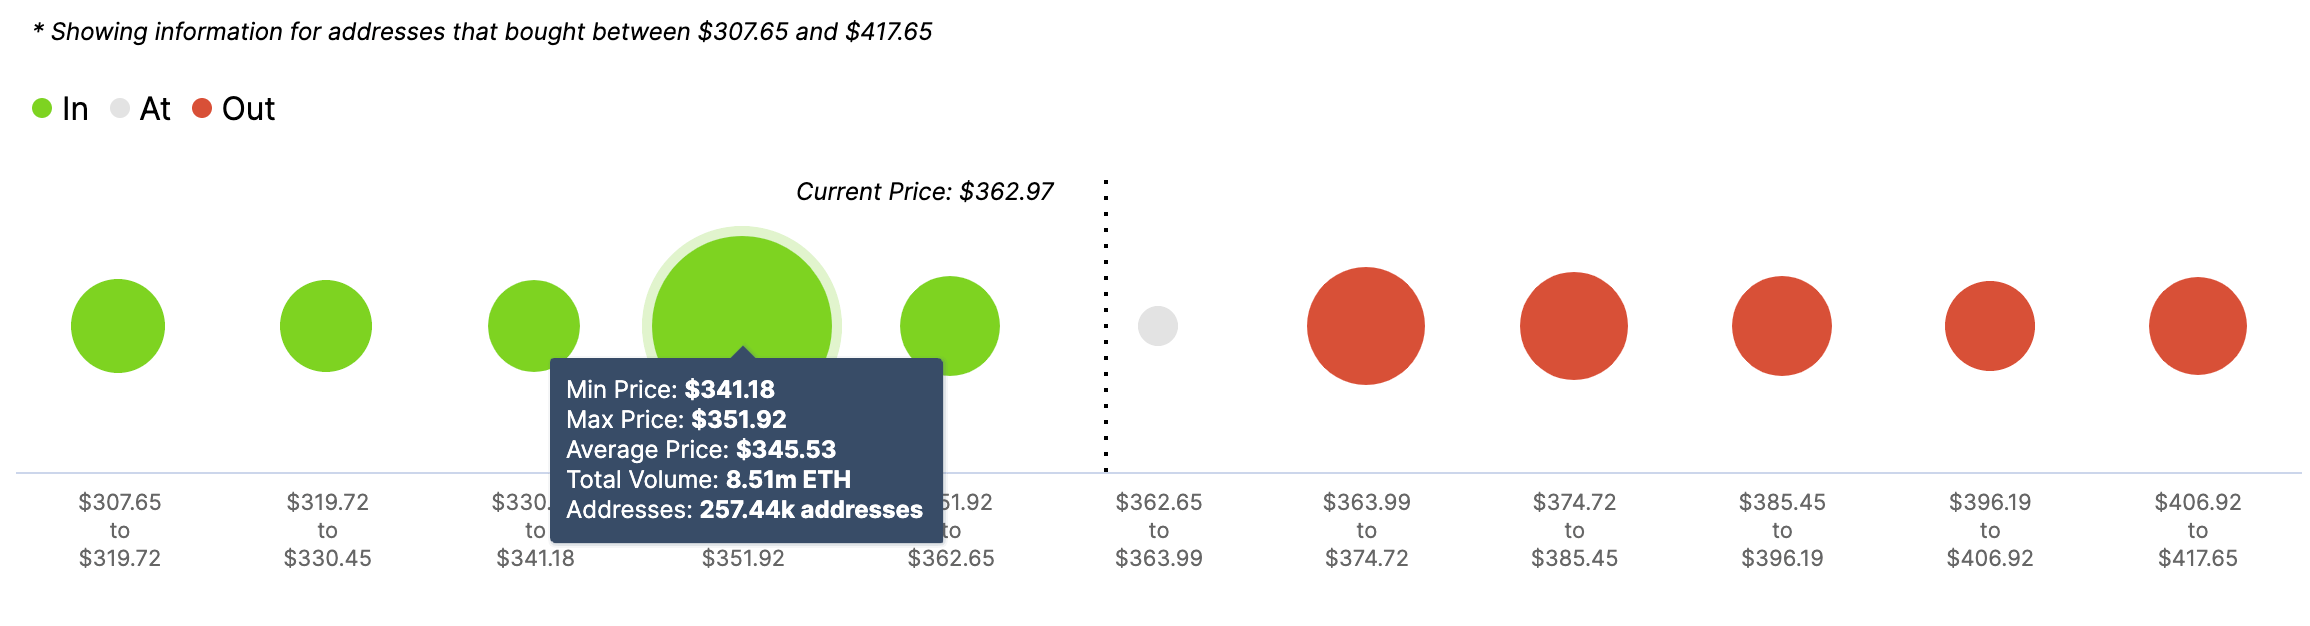
Source: Intotheblock
ETH/USD: The technical picture
On the daily chart, the SMA 50 and the middle line of the daily Bollinger Band at $385 adds credibility to this technical barrier and implies that a sustainable move above this area may unleash ETH's bullish potential. The next technical target comes at $450 (the upper line of the daily Bollinger Band), provided that the price clears the above-mentioned supply zone around the psychological $400.
ETH/USD daily chart
-637354096162167446.png)
The picture on the 4-hour timeframe shows that ETH/USD broke above SMA50. The next batch of technical barriers comes at $388 (SMA100) and $400 (SMA200), in full compliance with the outlined short-term recovery targets. On the downside, the first support comes at $353 (the middle line of the 4-hour Bollinger Band). Once it is passed, the sell-off may be extended towards the recent low of $310 (daily SMA100).
ETH/USD 4-hour chart
-637354096278895922.png)
To conclude: a combination of on-chain metrics and technical indicators implies that ETH may be poised for the further increase, provided that the price moves above the resistance area of $385-$400. Once this happens, the recovery may gain traction and bring the recent highs back into focus.
On the other hand, a sustainable move below $350 will negate an immediate optimistic forecast. If this is the case, the price may retest the recent low of $307 before another bullish leg.
Author

Tanya Abrosimova
Independent Analyst


