Strong fundamentals behind Ethereum support parabolic advance to $1,000
- Ethereum price is preparing to advance further as the fundamentals behind it have yet to be realized.
- The technicals also support a long term bullish outlook.
- Meanwhile, the network has seen a spike in activity as reflected on the rising gas fees.

It appears that Ethereum price is set for a significant rally as the much anticipated ETH 2.0 upgrade is set to launch in less than two weeks.
ETH 2.0 reinforces the bullish outlook behind Ethereum price
Scalability has been one of the major drawbacks inhibiting the Ethereum network, hence the need to introduce features to rectify these challenges.
Serenity is the last stage to increase the usability of the network and allow it to become the “world’s computer” as envisioned by its founder Vitalik Buterin. This protocol upgrade will integrate proof-of-stake and other features that will improve the blockchain’s speed while maintaining its security.
Another important feature is sharding, which according to blockchain service provider Consensys will significantly boost the throughput that the Ethereum network can process.
“Shard chains are a scalability mechanism in which the Ethereum blockchain is “split” into 64 different chains, which allows for parallel transaction, storing, processing of information. At its most conservative estimate, it will enable 64 times more throughput than Ethereum 1.0, but it is designed to be able to handle several hundred times more data than Ethereum 1.0.”
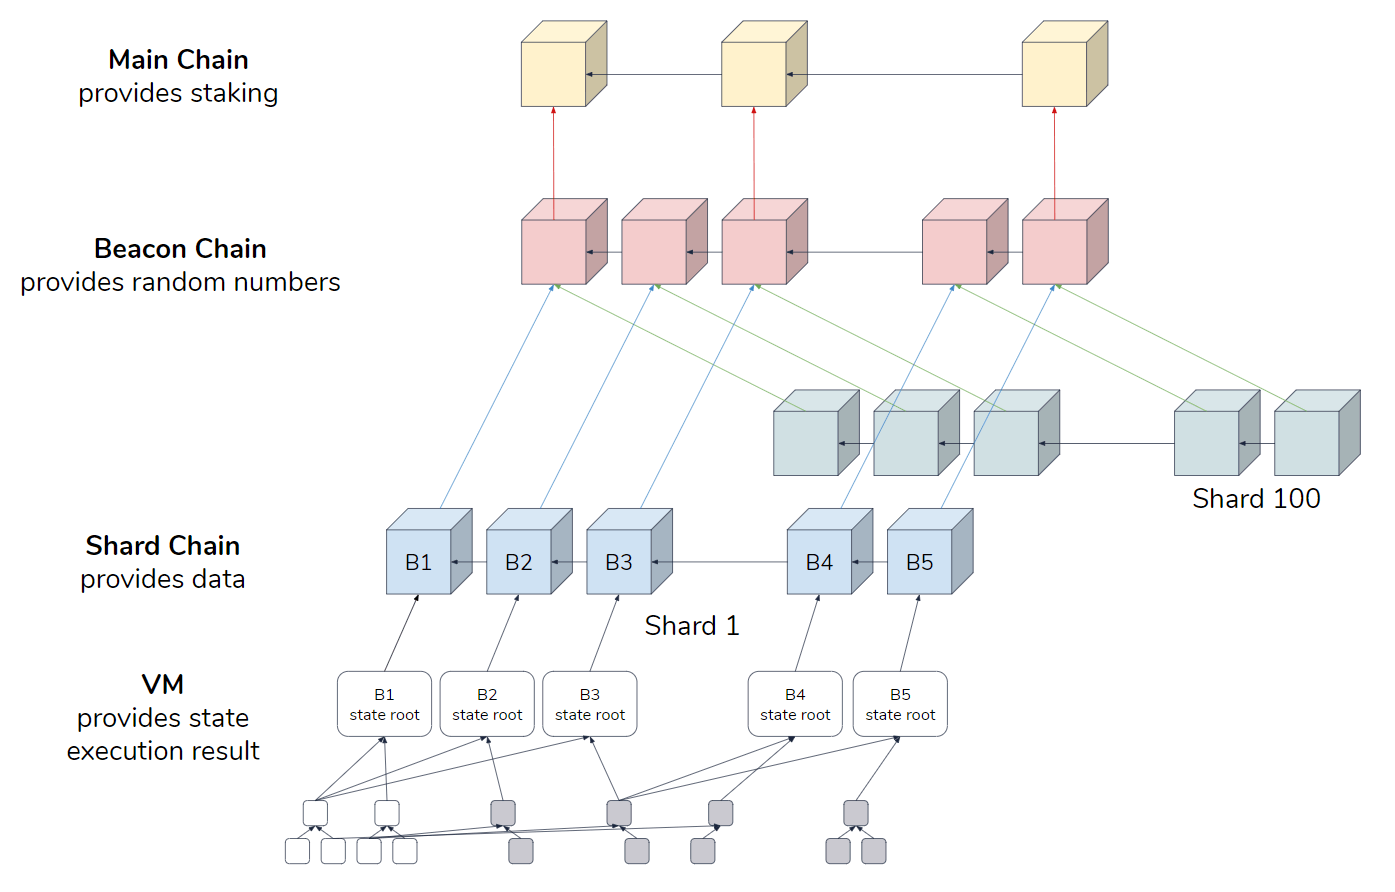
Ethereum 2.0 by Hsiao-Wei Wang
As Ethereum moves away from proof-of-work and enters a new proof-of-stake era, market participants will have to hold 32 ETH to collect staking rewards. This factor may trigger a spike in demand for the smart contracts token, subsequently impacting its price action.
A further upward advance on the horizon
Ethereum’s weekly chart shows that its price action developed a double bottom pattern over the past two years. Following the recent break of the 78.6% Fibonacci retracement level, it seems like ETH could surge towards the 23.6% Fibonacci retracement level at $1,100.
But first, it would have to slice through three other resistance barriers represented by the 61.8%, 50%, and 38.2% Fibonacci retracement levels. These hurdles sit at $600, $750, and $900, respectively.
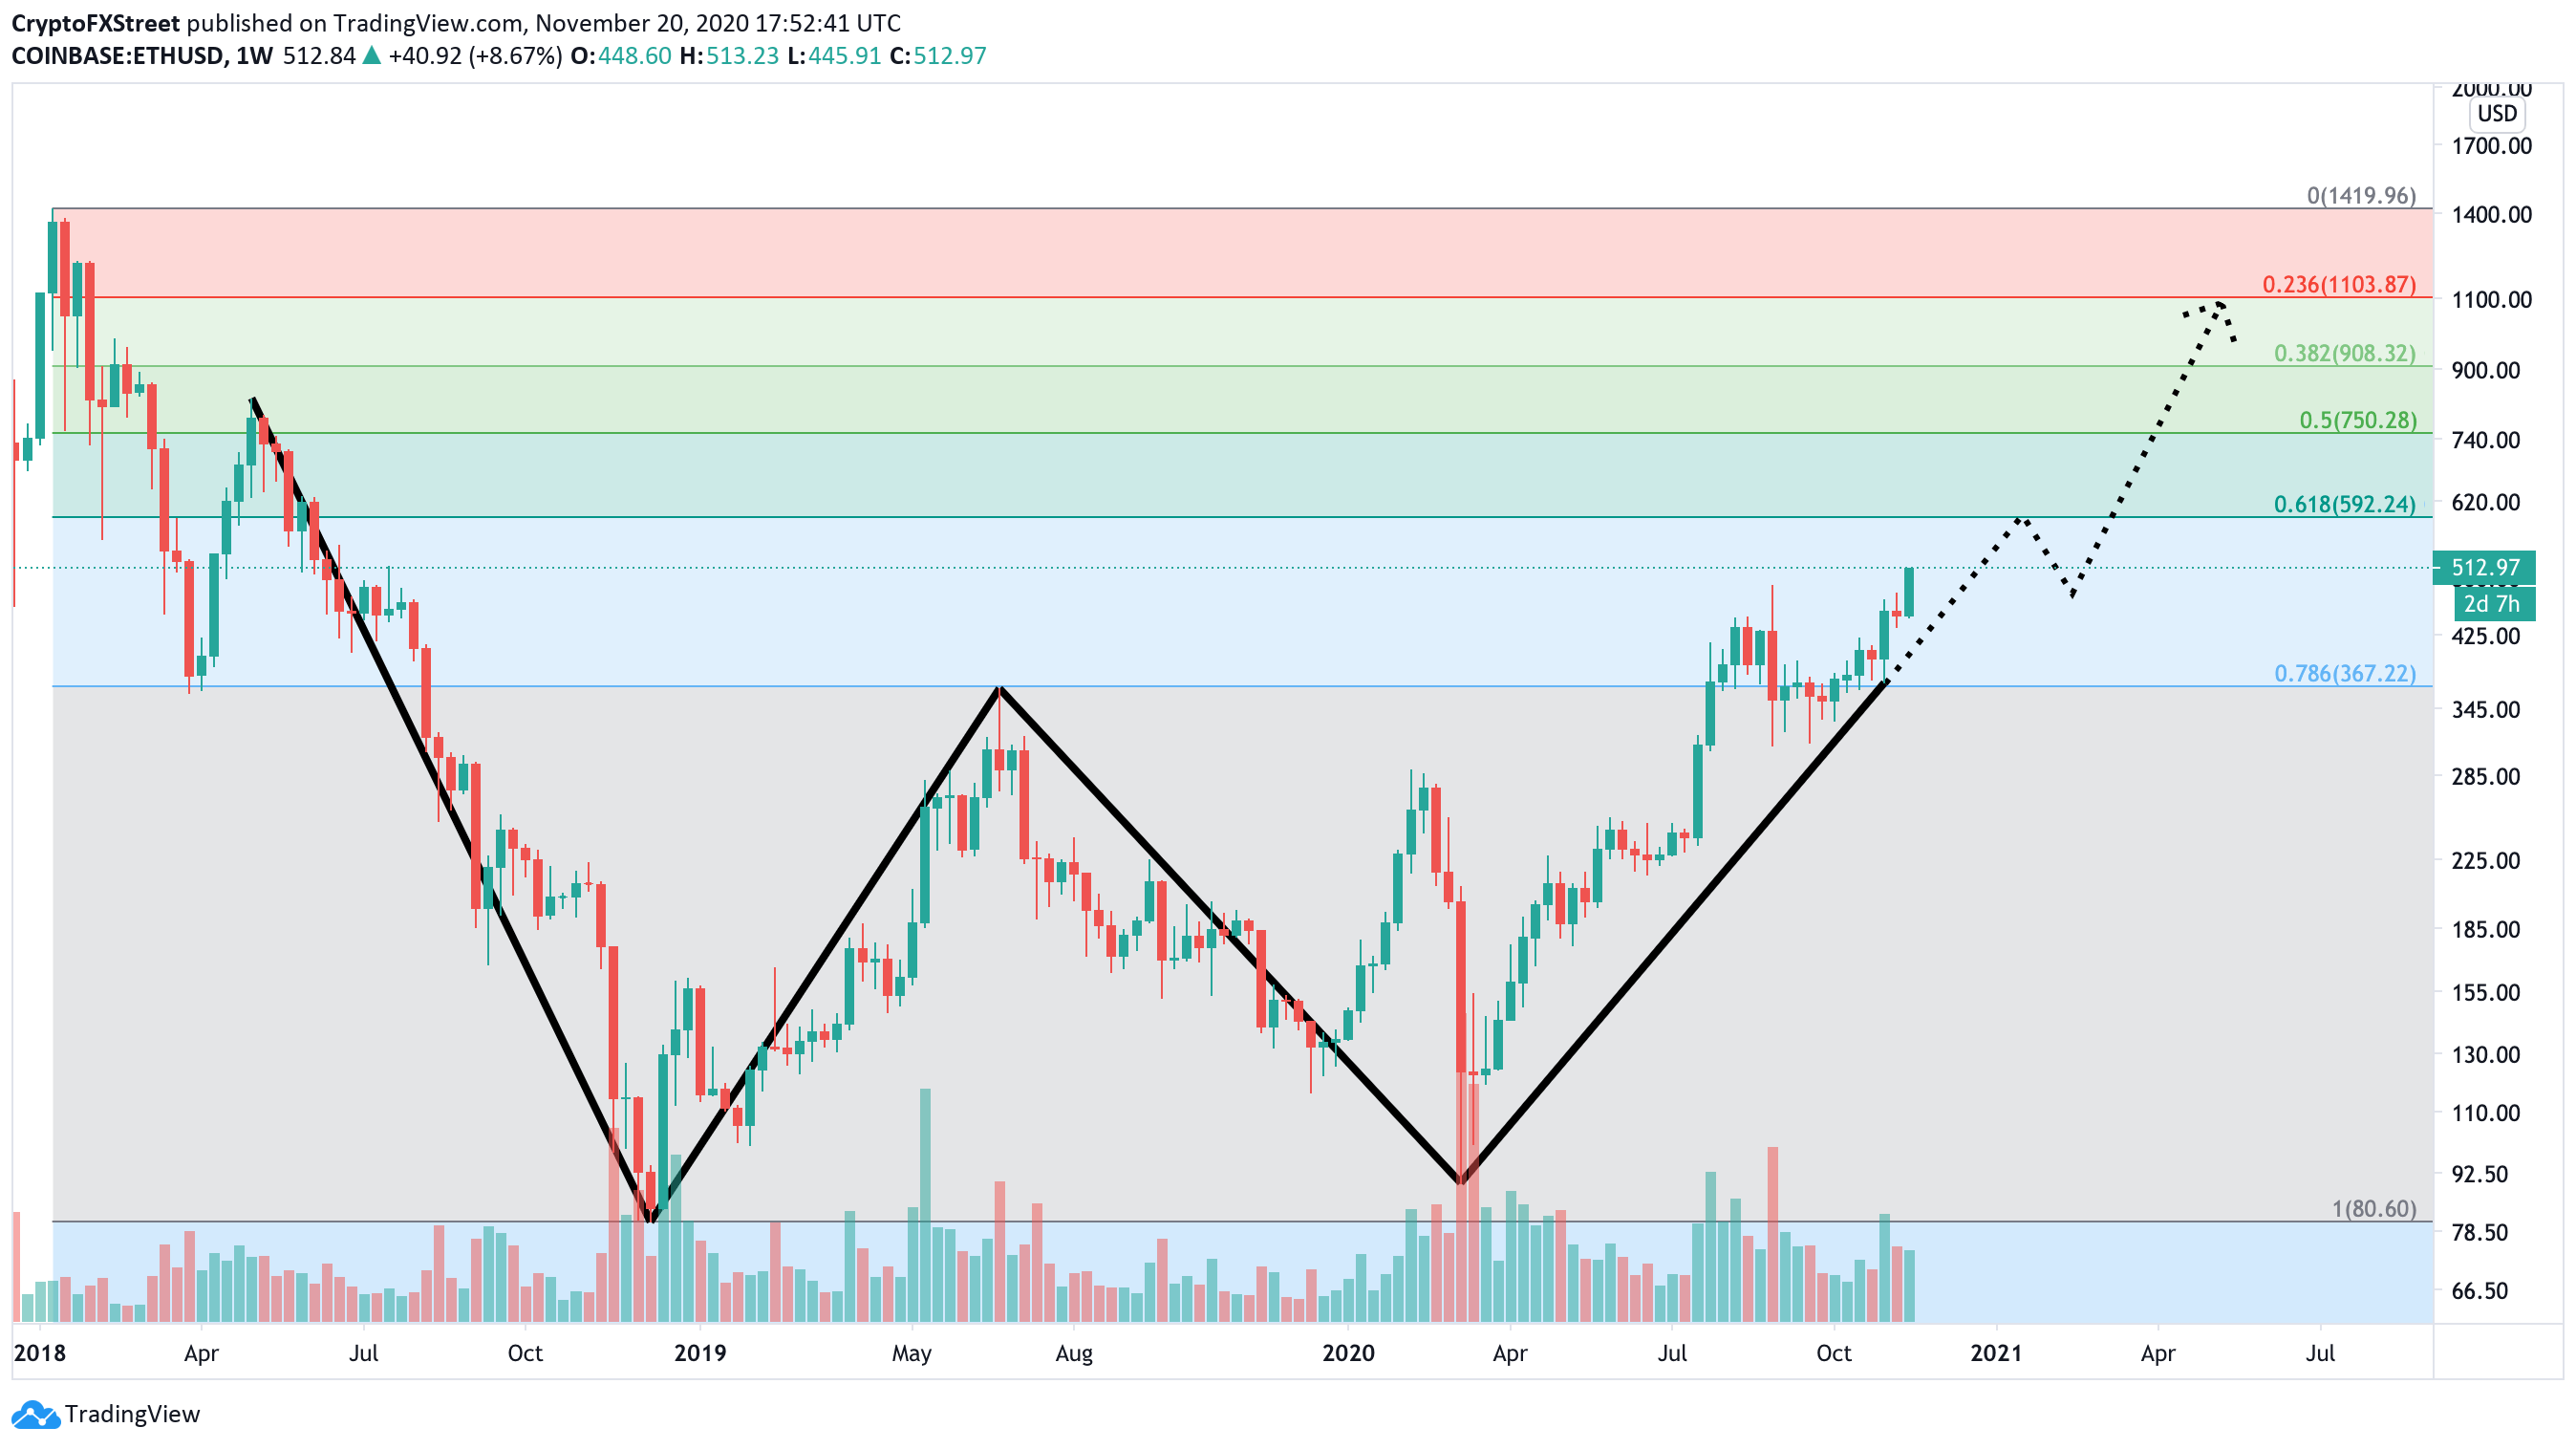
ETH/USD weekly chart
Ethereum bulls do not seem to show any signs of fatigue. If the buying pressure continues mounting at the current rate, the smart contract token might be poised for new all-time highs within the next year.
It is worth mentioning that the cryptocurrency community has been growing concerned on whether the Ethereum Foundation will be able to reach the 524,000 ETH threshold required for launching ETH 2.0 into mainnet. Failing to do so could have serious consequences on Ethereum price as it may invalidate the bullish outlook.
Author
FXStreet Team
FXStreet
Composed of a group of economic journalists and FX experts, the FXStreet content team produces and oversees all content published on FXStreet. It provides a purely journalistic approach to the Forex market.


