Ethereum Price Prediction: ETH/USD bullish setup to $250 – Confluence Detector
- Ethereum price holds between the confluence support at $237 and the resistance at $239.
- ETH/USD holds strongly in consolidation as a breakout above the trendline resistance brews eyeing $250.

Ethereum recovered from last week’s lows at $228 over the weekend. A few seller congestion areas were broken including $235. ETH/USD closed in on the hurdle at $240 but the resistance from a descending trendline put a limit to the bulls’ effort. Instead, the largest altcoin settled for consolidation around the 61.8% Fibonacci retracement level taken between the last swing high of $249.12 to a swing low at $223.30.
In the meantime, ETH/USD is trading at $238 while holding above both the 100 SMA and the 50 SMA in the 2-hour range. The Elliot Wave Oscillator has started a bullish session which means that gains are likely to continue following the ongoing consolidation.
A study of the RSI shows that the trend is sideways but leaning more to the bearish side. This follows a retreat from the overbought region. It is essential to watch the RSI as it could tell the direction Ether would take in the near term; a return above 70 would signal a bullish momentum but a continued negative gradient could see the price dive under $235 support.
On the bright side, buying pressure is not entirely ousted. Therefore, if a break above the trendline resistance as well as the $240 hurdle would propel Ethereum back to $250. For now, holding tightly to the consolidation between $237 and $239 is key for the next stage of attack towards $250.
Related content: Bitcoin Price Forecast: BTC/USD triangle breakout eyes lift-off to $10,000
ETH/USD 2-hour chart
 (1)-637308250552591524.png)
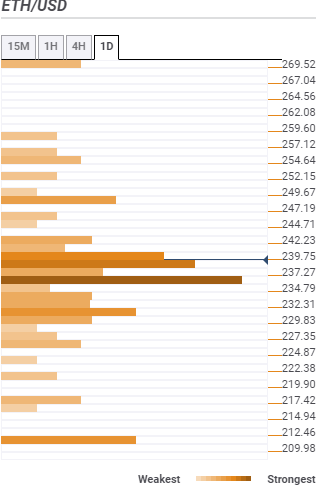
Ethereum confluence resistance and support levels
Resistance one: $239.75 – Is the first resistance as highlighted by the previous high 15-minutes, the Bollinger Band 15-minutes middle curve, the SMA ten 15-minutes, the Bollinger Band 15-mins upper curve and the previous high 1-hour.
Resistance two: $249.67 – A seller congestion zone that houses the pivot point one-month resistance one and the Bollinger Band one-day upper curve.
Support one: $237.27 – Is the buyer concentration zone that is home to the 50 SMA one-day, the Bollinger Band 1-hour middle, the SMA 4-hour and the SMA 200 1-hour.
Support two: $232.31 – Hosts the Bollinger Band 1-hour lower curve, pivot point one day support two and the Bollinger Band 4-hour lower.
Author

John Isige
FXStreet
John Isige is a seasoned cryptocurrency journalist and markets analyst committed to delivering high-quality, actionable insights tailored to traders, investors, and crypto enthusiasts. He enjoys deep dives into emerging Web3 tren


