Ethereum price analysis: Defends key support, this sideways trend has more to give
- After defending key support, ETH/USD trend sideways within a narrow range.
- A bullish momentum continues to build supported by both the 50-day SMA and the 100-day SMA.

Ethereum is seen trading within a narrow range after defending the key support at $100. The current stability comes after Ethereum spend the all the sessions on Monday in the red. While the digital asset has not been able to recover from the Monday morning fall, it has made a slight progress to the upside testing the range limit at $108 severally.
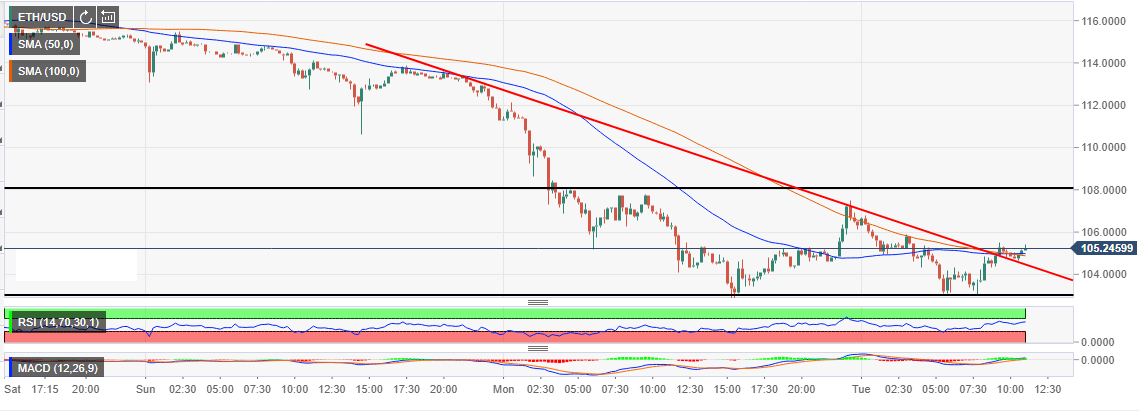
At press time, the bulls have pushed the price above the trendline resistance at $104.91. Ethereum is currently trading at $105.15. A bullish momentum continues to build while supported by both the 50-day Simple Moving Average (SMA) and the 100-day SMA. The immediate resistance is at $106, although all the eyes are locked on $108 (supply zone).
Trending higher are technical indicators like the Relative Strength Index (RSI) (15’ range) at 64.70 and the Moving Average Convergence Divergence (MACD) at +0.22772. This means that the bulls are back and buying entries are out performing the selling pressure. For now, the trend is bullish and Ethereum is either going to stay within the narrow range or breakout towards $110 resistance zone.
ETH/USD 15’ chart
Get 24/7 Crypto updates in our social media channels: Give us a follow at @FXSCrypto and our FXStreet Crypto Trading Telegram channel
Author

John Isige
FXStreet
John Isige is a seasoned cryptocurrency journalist and markets analyst committed to delivering high-quality, actionable insights tailored to traders, investors, and crypto enthusiasts. He enjoys deep dives into emerging Web3 tren


