Ethereum is testing strong support [Video]
![Ethereum is testing strong support [Video]](https://editorial.fxsstatic.com/images/i/ETH-bullish-line_XtraLarge.png)
Ethereum with ticker ETHUSD slowed down recently, but it can be already approaching strong support around 4000 - 3900 area, as we also see a corrective movement from the highs that can extend the bullish cycle.
ETHUSD Longs/Shorts ratio chart is at 3-year low due to massive rise on ETHUSD shorts, because speculators want to short Ethereum, but that usually indicates for the support. Notice that Ethereum is right now testing previous highs that can act as a support, so there could be space for more gains.
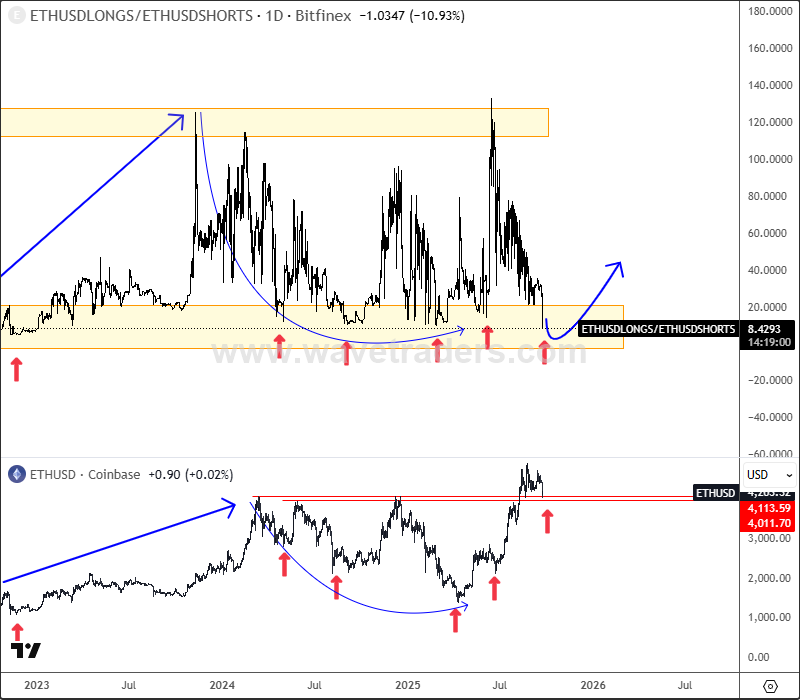
ETHUSD Longs/Shorts Daily Ratio Chart VS. Ethereum
Also, notice that ETHBTC pair slowed down after a massive extension higher into wave 3, and it's right now testing important 0,035 - 0,034 support zone within an abc correction for wave 4. It's also trading at an important 38,2% Fibonacci retracement and base channel upper line, which can act as a strong support and it's actually a textbook pattern. So soon watch out for a bullish continuation within wave 5, especially if we see a rebound and recovery back above channel resistance line near 0,038 level. Bullish confirmation is above 0,041 level, while the invalidation level is at 0,026.
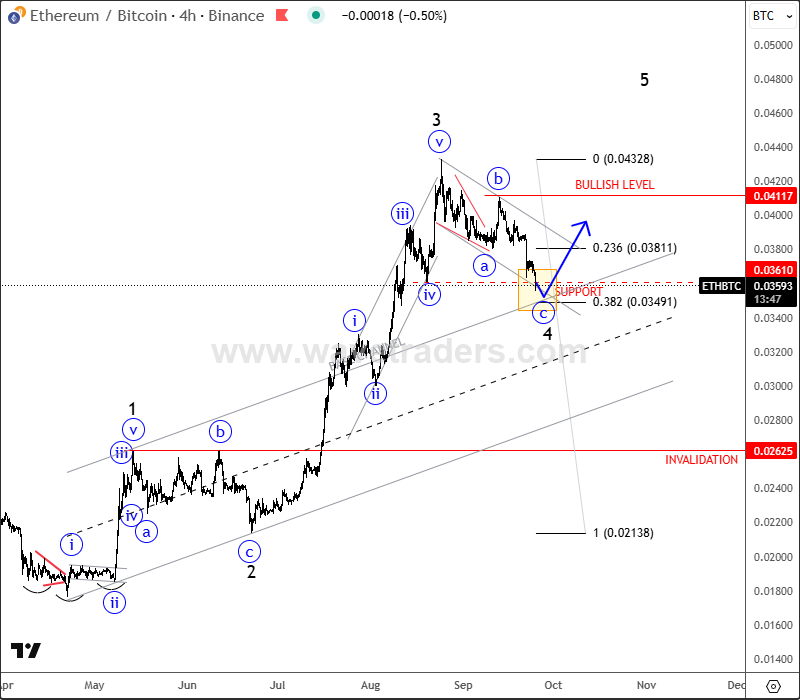
ETHBTC 4H Chart
For a detailed view and more analysis, you can watch below our latest recording of a live webinar streamed on September 22:
Get Full Access To Our Premium Elliott Wave Analysis For 14 Days. Click here.
Get Full Access To Our Premium Elliott Wave Analysis For 14 Days. Click here.
Author

Gregor Horvat
Wavetraders
Experience Grega is based in Slovenia and has been in the Forex market since 2003.


