Ethereum dominance over Bitcoin draws to close, no more flippening?
- Ethereum price dominance over Bitcoin and the rest of the crypto industry continued throughout October.
- Analysts at crypto intelligence platform Santiment believe Ethereum’s dominance is coming to a close as ETH address activity declines.
- Analysts remain bullish on Ethereum price, despite declining dominance, set a target of $10,000 for the altcoin.

Ethereum flippening Bitcoin is a narrative in which ETH’s market capitalization exceeds that of BTC. This narrative gathered steam when Ethereum’s dominance over the crypto market climbed and gained popularity after transitioning from a proof-of-work consensus mechanism to proof-of-stake.
Also read: Shiba Inu price: Is SHIB the next meme coin to explode, Dogecoin-killer rallies 20%
Ethereum price dominance sustains throughout October
Ethereum, the second-largest cryptocurrency by market capitalization witnessed a massive breakout earlier this month. ETH yielded 24% gains for holders over the past week and the altcoin recouped its losses from earlier this cycle, in the bear market.
Ethereum price climbed above the critical level of $1,400 and sustained its uptrend, hitting a monthly high of $1,645 on October 29. The altcoin’s rally has been attributed to its rising dominance, bullish sentiment among ETH holders, and deflationary nature.
Based on data from crypto intelligence tracker Santiment, Ethereum’s price dominance over Bitcoin and most cryptocurrencies continued throughout October. Though the altcoin’s dominance is now drawing a close, it stands at 18.3%. When Ethereum price broke past the $1,400 level, many new ETH addresses were created.
A spike in address activity is a driver of an asset’s price rally. Therefore, analysts at Santiment argue that a revival of Ethereum’s address activity could fuel a confident rally in the altcoin.
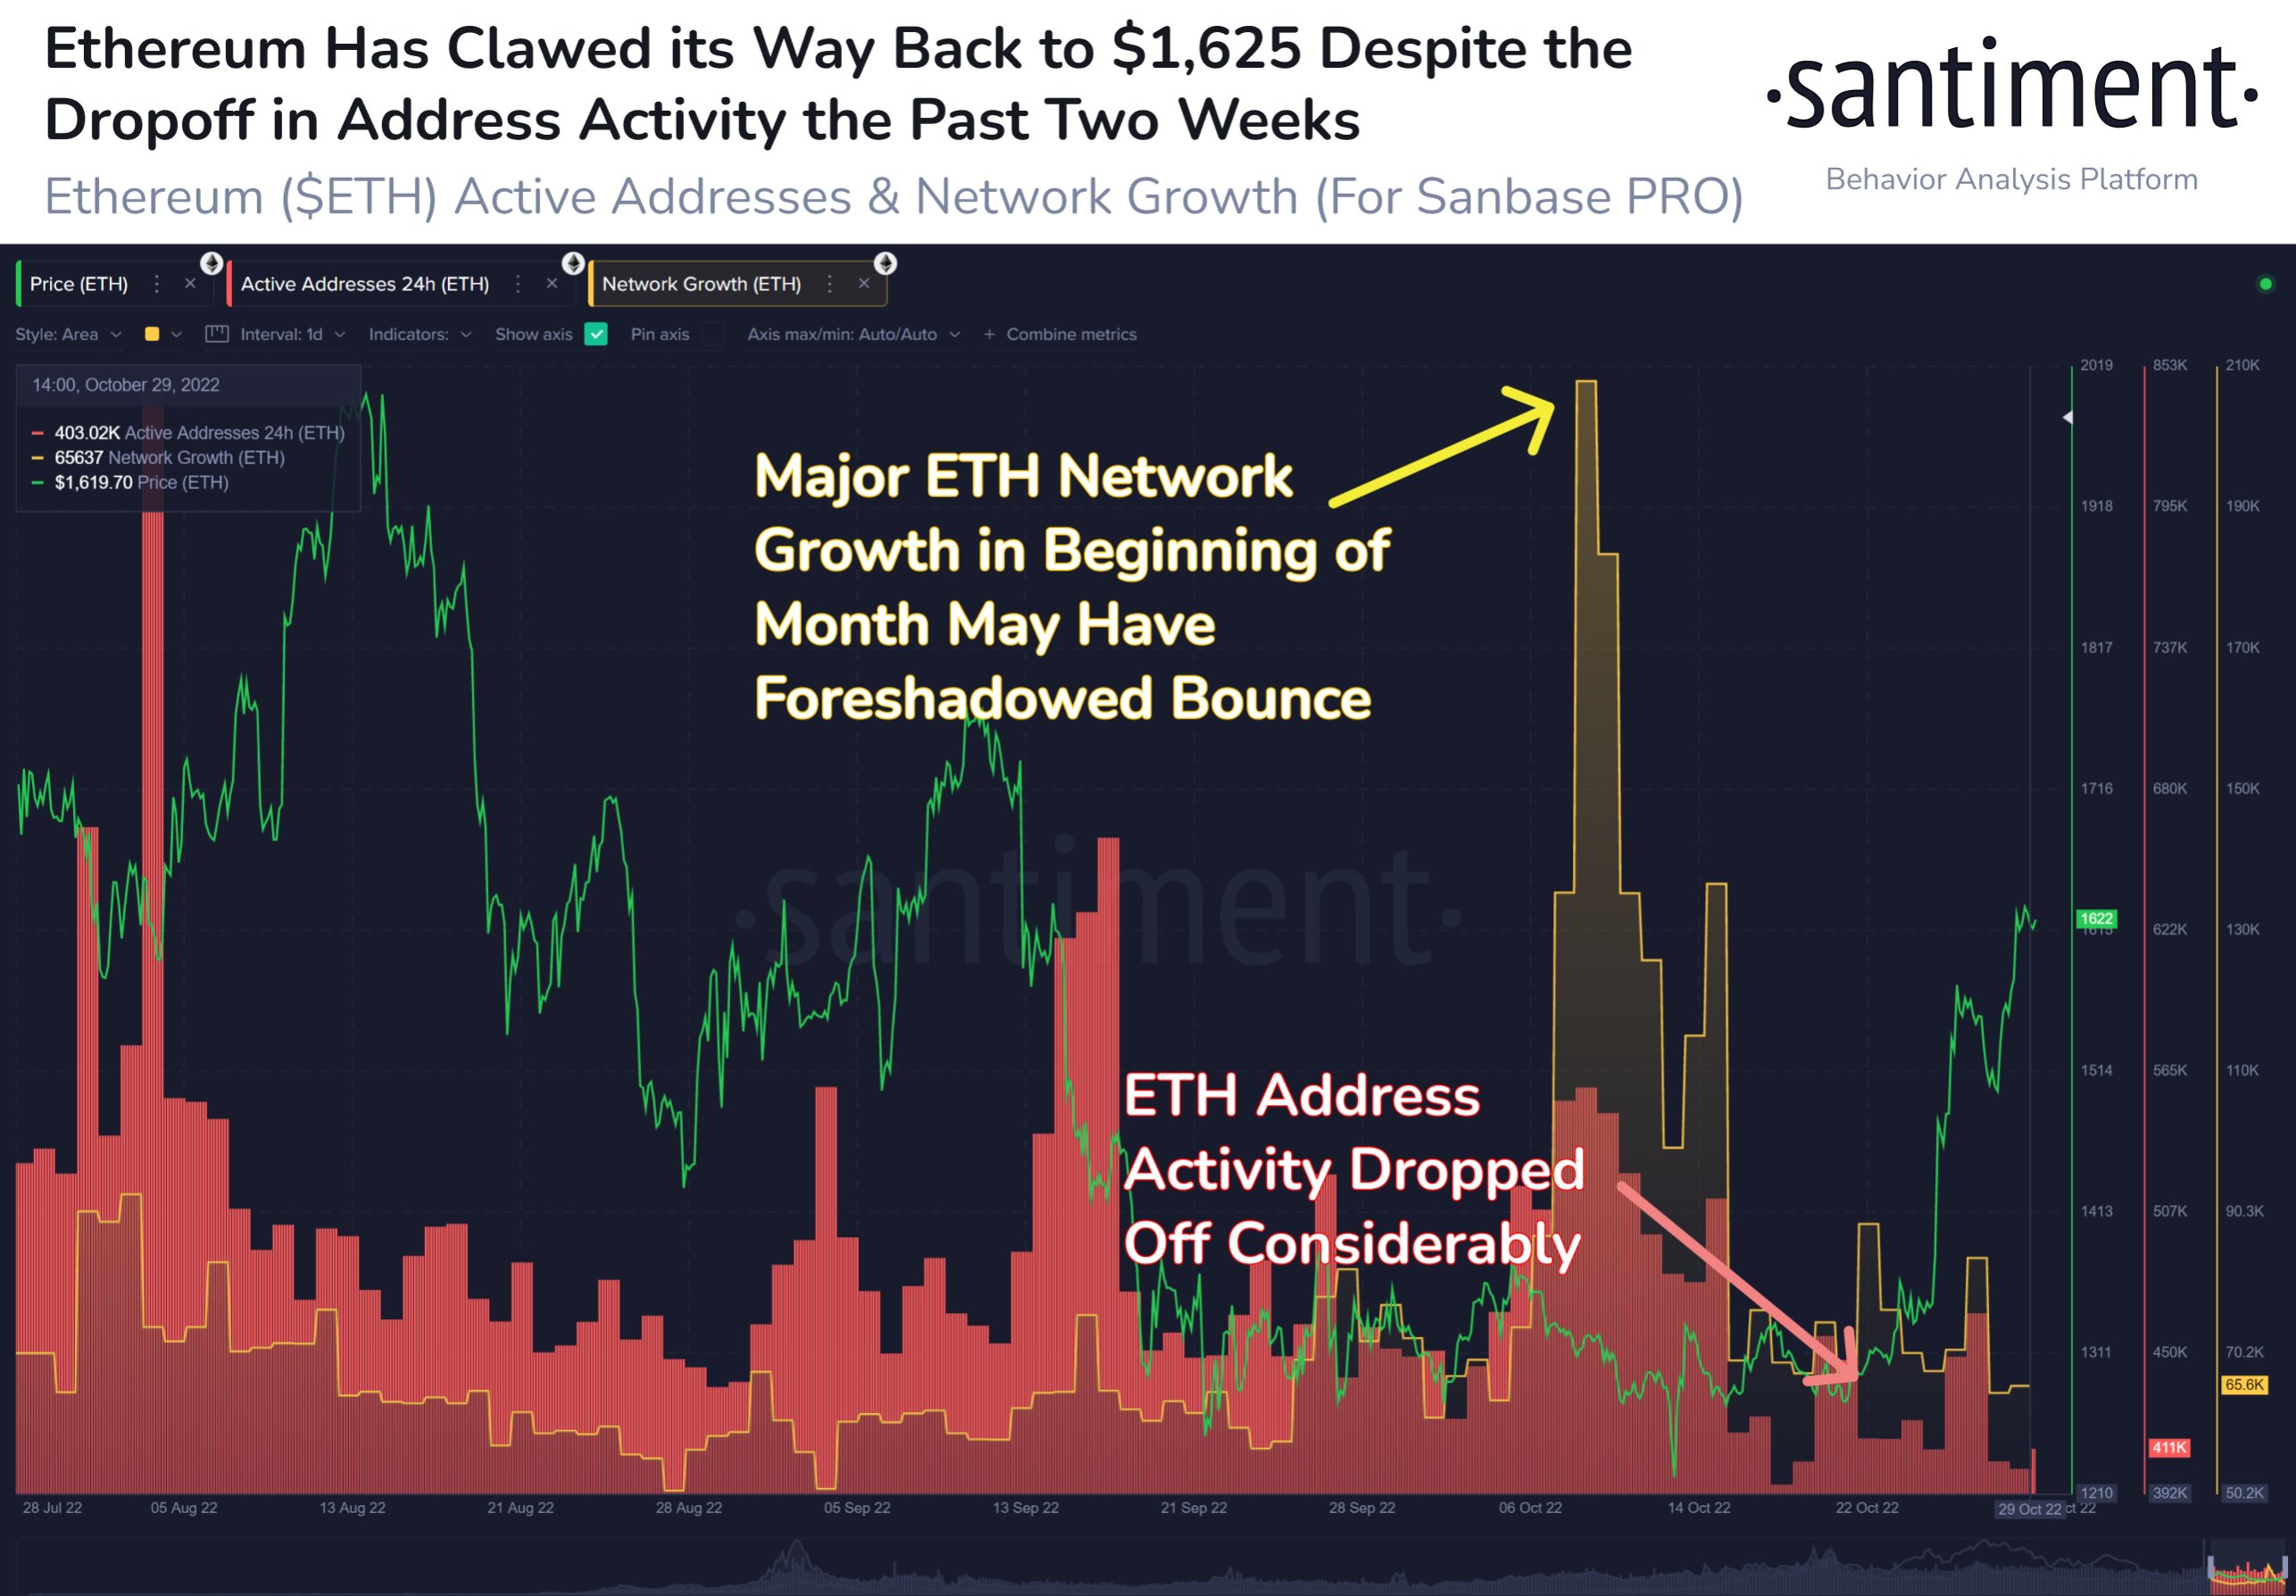
Ethereum dominance and address activity
Analysts remain bullish on Ethereum price rally
@Pentosh1, crypto analyst and trader evaluated the ETH/USDT price chart and identified new ranges. Ethereum price flipped resistance to support, therefore $1,516 is now the range low, $1,650 is mid and the $1,783 level is the new range high for the altcoin.
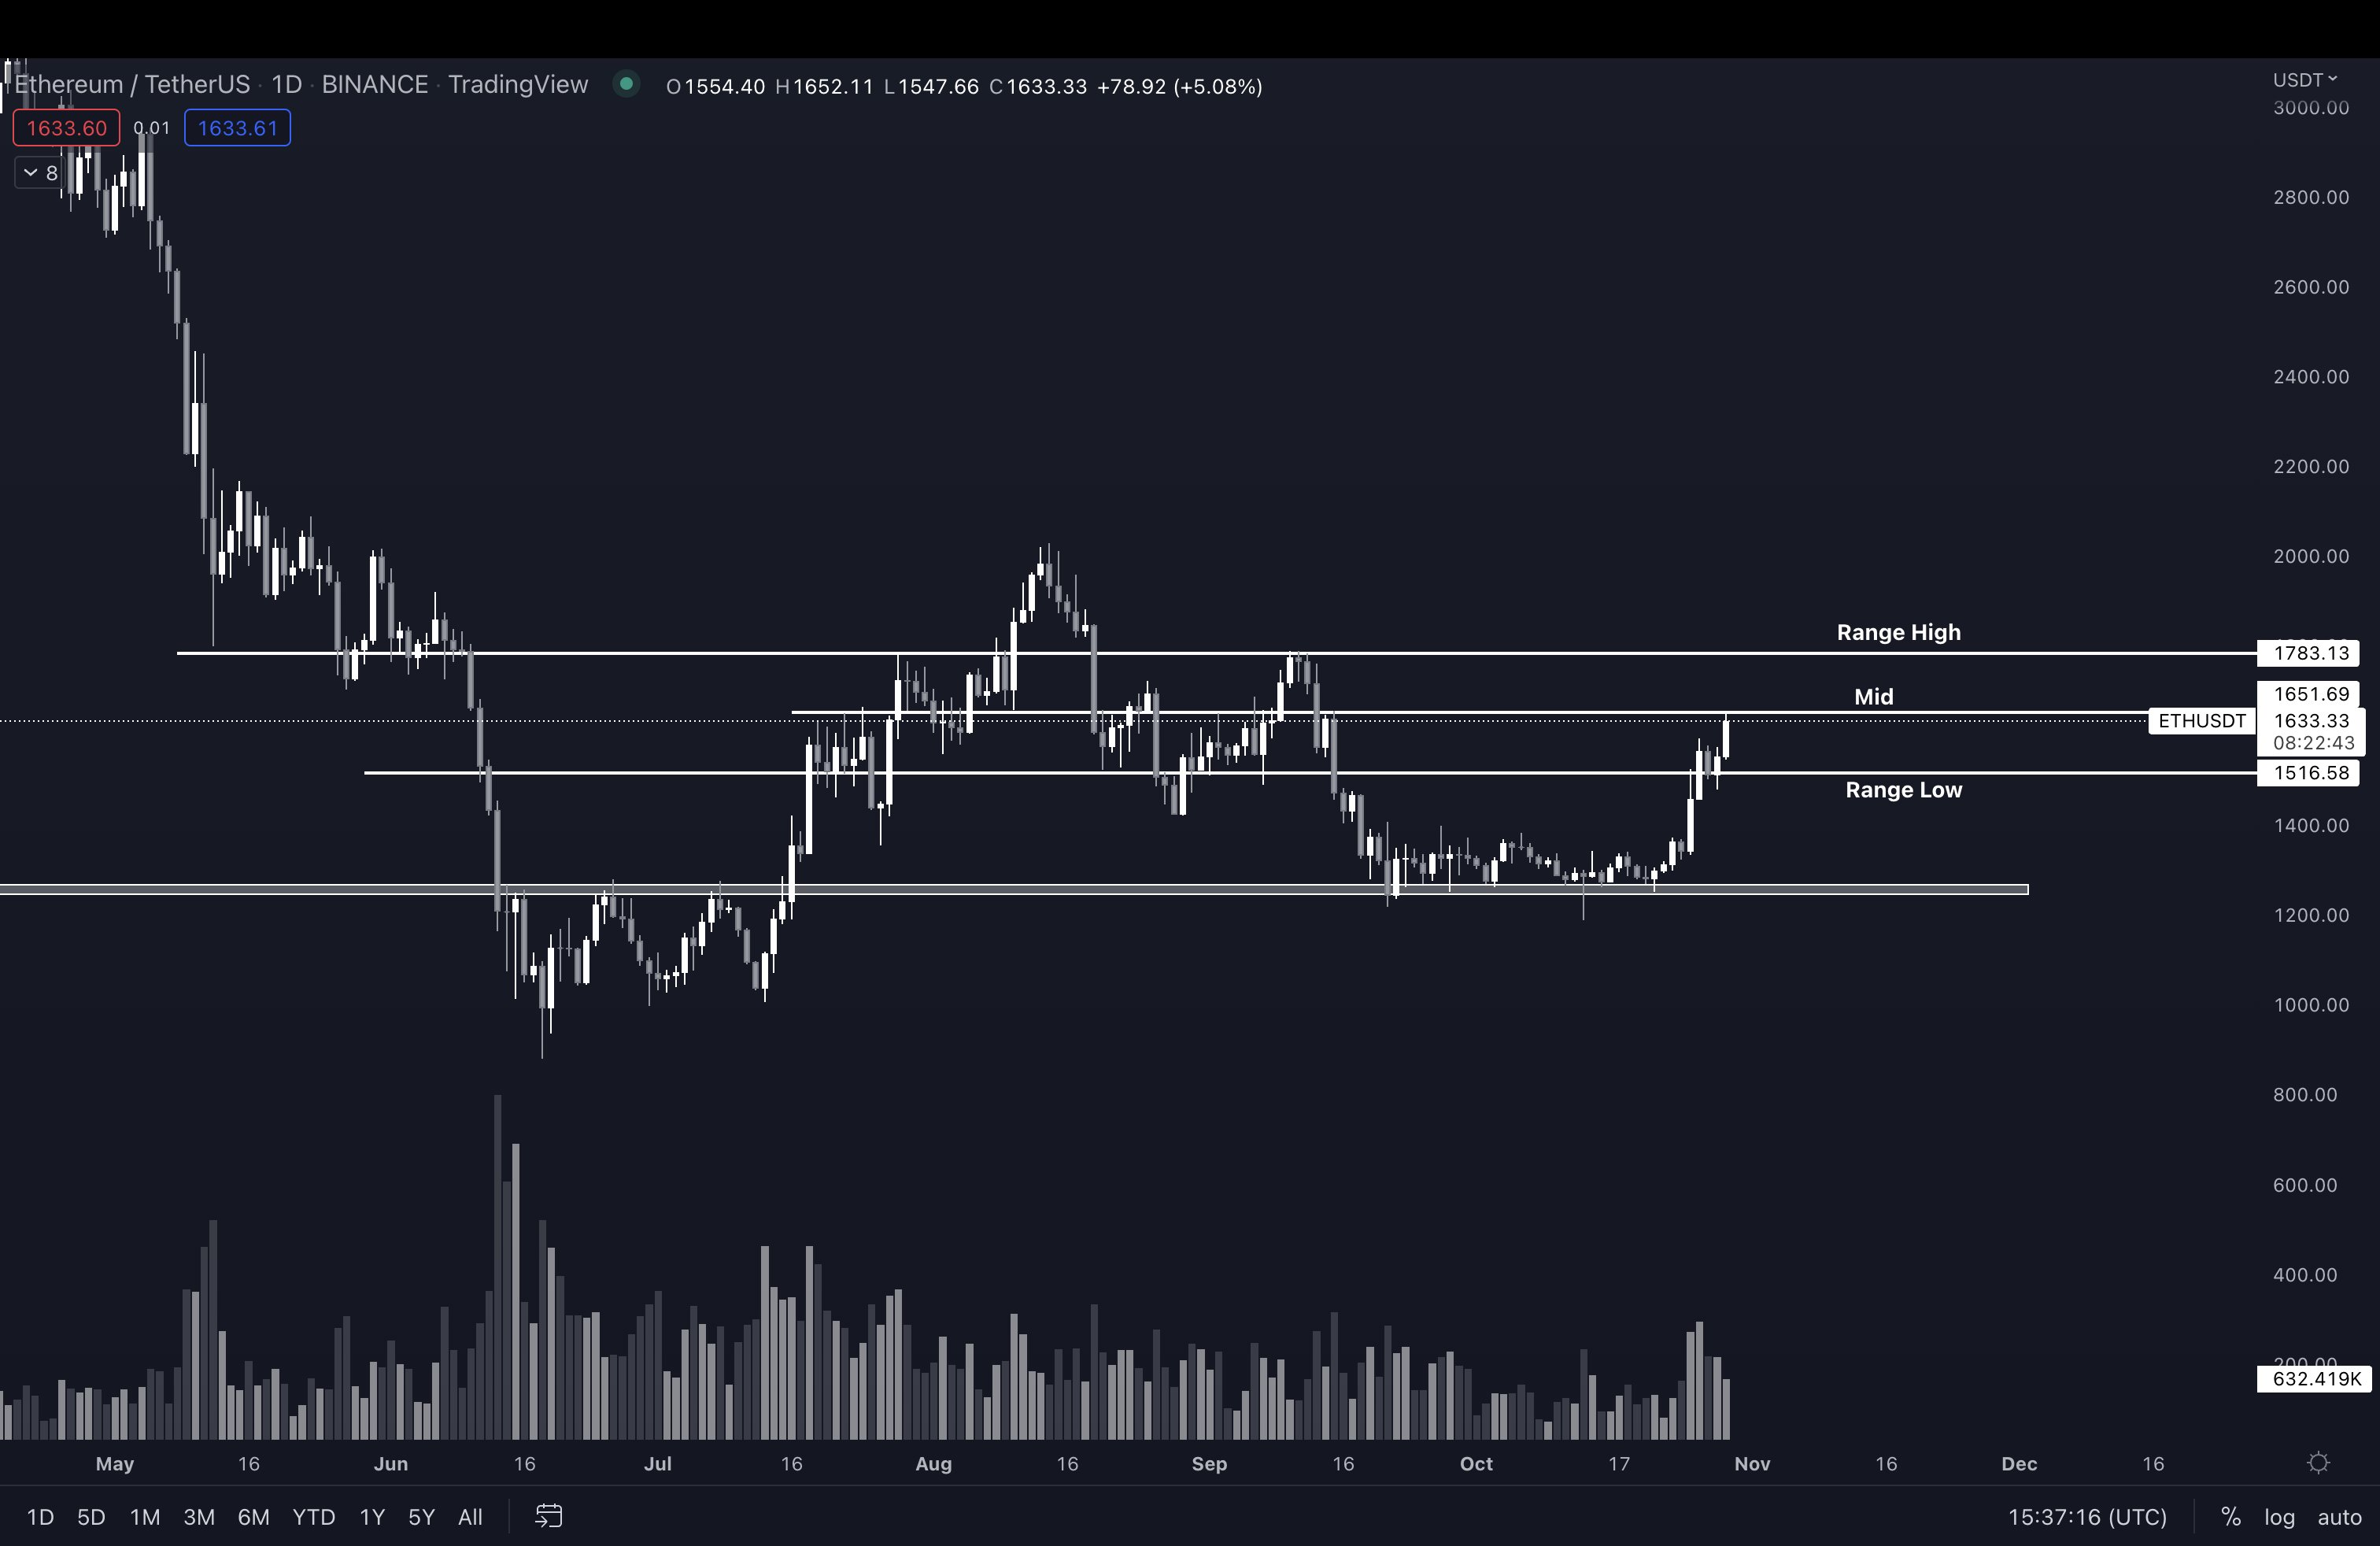
ETH/USDT price chart
A breakout past the range high, followed by confirmation of the uptrend, could signal a continuation of the altcoin’s climb. SmartContracter, a pseudonymous analyst on Twitter remains bullish on Ethereum price rally to the $10,000 level, a long-term bullish target.
Eventually Ethereum will give us that run to $10k everyone was talking about last year.
— Bluntz (@SmartContracter) October 29, 2022
The hard part is surviving long enough to see it happen.$ETH
Author

Ekta Mourya
FXStreet
Ekta Mourya has extensive experience in fundamental and on-chain analysis, particularly focused on impact of macroeconomics and central bank policies on cryptocurrencies.



