Ethereum: Buying the dips at the blue box area

Hello fellow traders. In this technical article we’re going to take a look at the Elliott Wave charts charts of ETHUSD published in members area of the website. As our members know Ethereum has given us 3 waves pull back recently that found buyers right at the Blue Box ( Buying Area). We have been favoring the long side due to impulsive bullish sequences the crypto is showing in the cycle from the October 2023 low. In further text we’re going to explain the short term Elliott Wave forecast and trading setup.
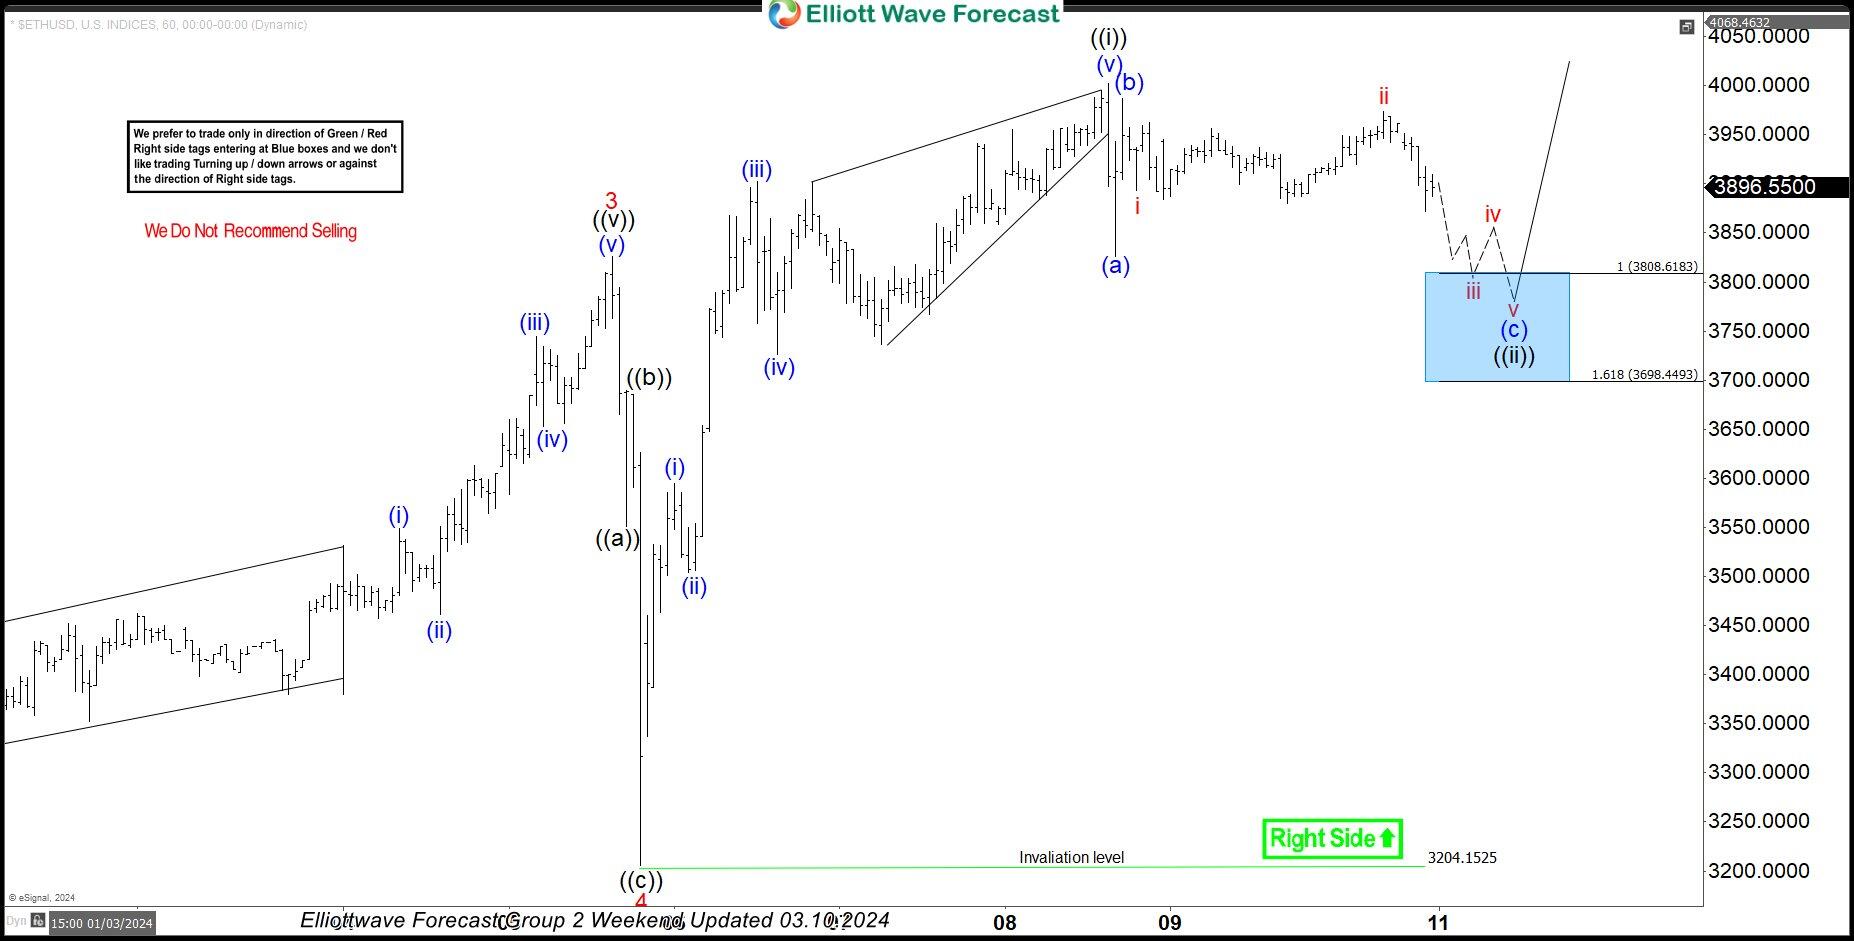
ETHUSD Elliott Wave 1 hour chart 03.10.2024
Current view suggests Ethereum ended short term cycle from the 3204.15 low as 5 waves rally -((i)) black. Currently the crypto is doing intraday pull back , wave ((ii)) black. We expect to see another leg down (c) of ((ii)) to complete the structure. We don’t recommend selling ETHUSD and prefer the long side from the marked Blue Box ( buying zone). Once Ethereum reaches our buying area, it should ideally make either rally toward new highs or in 3 waves bounce alternatively. When bounce reaches 50 Fibs against the (b) blue high, we will make long position risk free ( put SL at BE) and take partial profits.
Quick reminder on how to trade our charts :
Red bearish stamp+ blue box = Selling Setup
Green bullish stamp+ blue box = Buying Setup
Charts with Black stamps are not tradable.
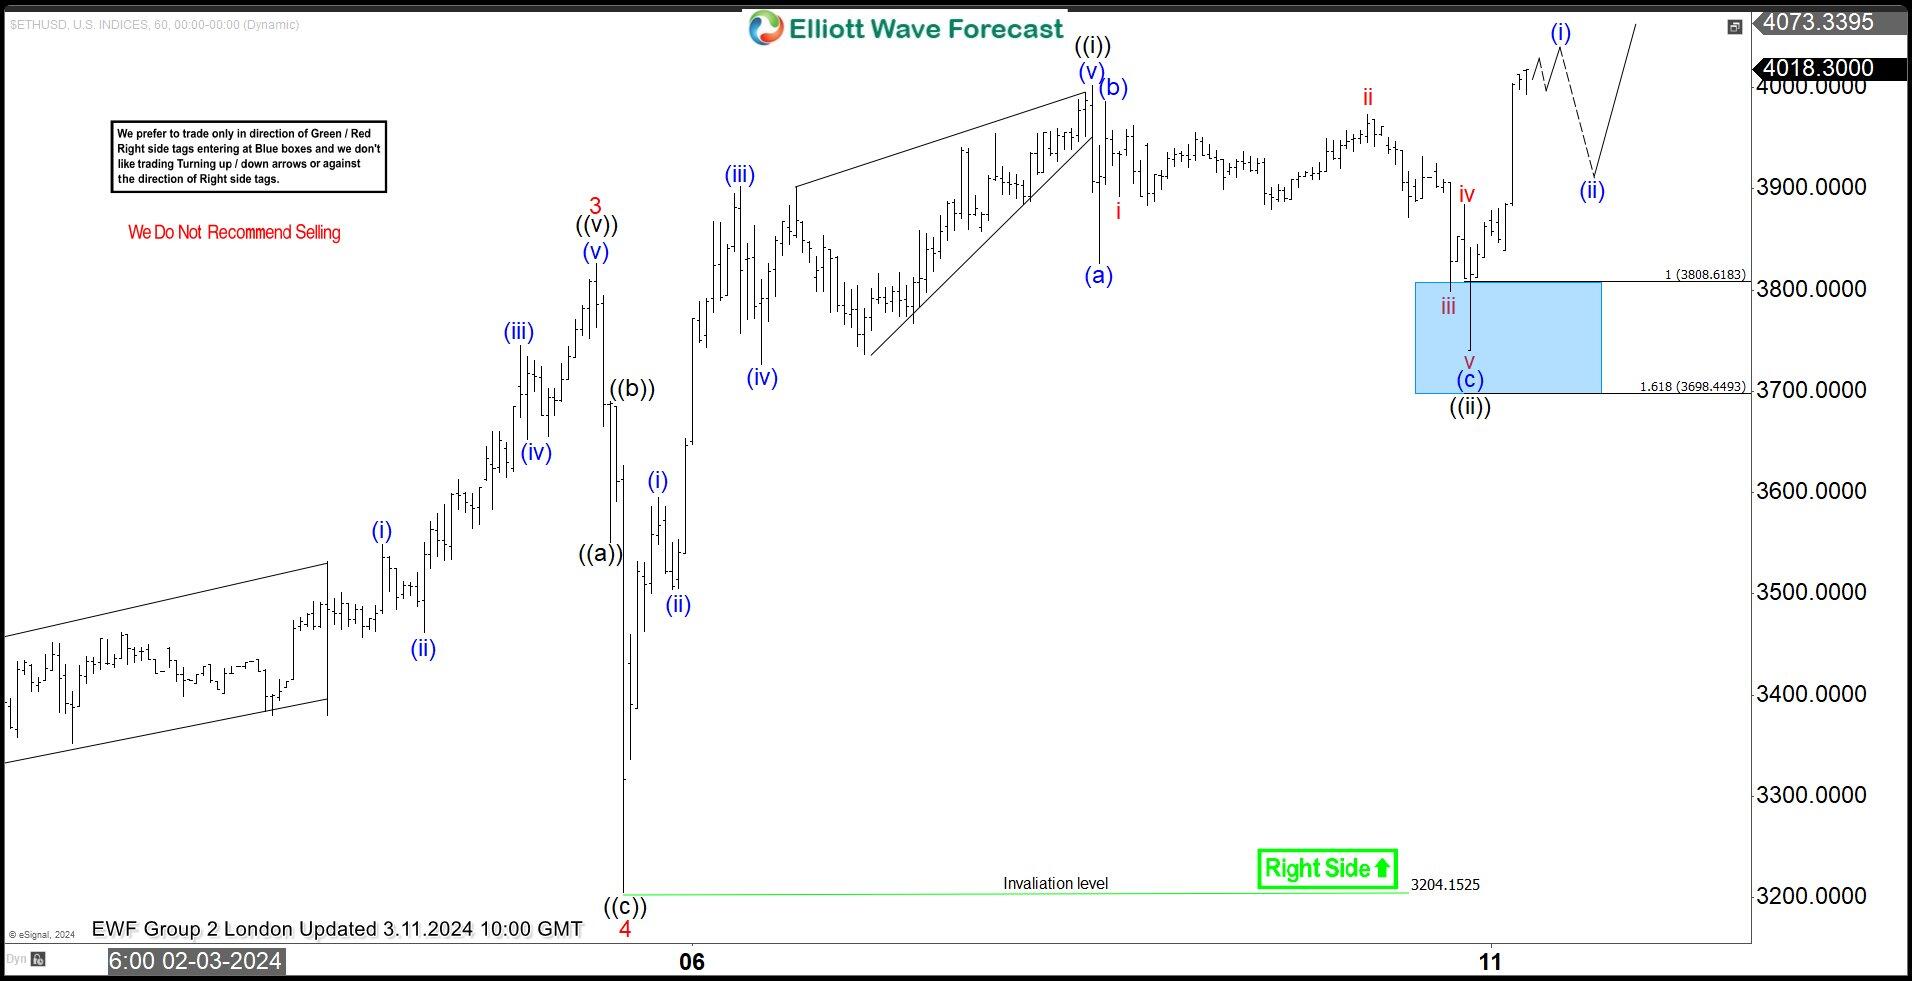
ETHUSD Elliott Wave 1 hour chart 03.11.2024
Ethereum found buyers right at the marked blue box as expected and we got good reaction from there. Pull back completed at 3733 low. Rally from that level looks impulsive. We expect ETHUSD to keep finding intraday buyers in 3,7,11 swings and we don’t recommend selling in any proposed pull back.
Keep in mind that market is dynamic and presented view could have changed in the mean time.
New to Elliott Wave ? Check out our Free Elliott Wave Educational Web Page and download our Free Elliott Wave Book.
Author

Elliott Wave Forecast Team
ElliottWave-Forecast.com


