Elrond Price Prediction: EGLD massive 800% rally pauses, a dead-cat bounce or readying a weekend rally?
- Elrond has been rejected from the all-time high at $220, resulting in losses under $200.
- A sell signal on the daily chart appears to have catalyzed the overhead pressure.
- The bearish outlook will be ignored if EGLD holds at the ascending parallel channel lower boundary.

Elrond has hit a resistance barrier after a whopping 800% rally since the beginning of January. The altcoin’s exponential growth ignored most of the dips in Bitcoin price encountered in the past few weeks. A new all-time high was formed at $220 before the ongoing correction took over. For now, EGLD is exchanging hands at $180 as bears return with a bang.
Update February 11: Elrond has been consolidating its previous moves and rising by around 1% to hit $178 at the time of writing. Is it a dead cat bounce after EGLD dropped from the highs of $215? A pattern of a limited advance from the lows before taking another dive. Even a dead cat bounces when falling on the floor. However, some may see the current range trading as an energy-saving phase before Elrond makes another sharp rise to the upside. Will it happen over the weekend? Lower trading volume may result in robst moves.
Update: Elrond (EGLD) has resumed its rise, recapturing the $180 level and advancing toward $183 as of Wednesday. The cryptocurrency has been holding onto most of its recent gains and stands in robust trading volume. According to CoinMarketCap, the digital coin's capitalization has surpassed $3 billion once again, placing it 24th among its peers – above the valuation of Tezos (XTZ). Is the profit-taking over? That remains an open question.
Elrond embarks on a gain-trimming exercise
The hourly chart shows that EGLD has been trading within an ascending parallel channel, guiding the bulls to new highs. However, the upper boundary remained unbroken, allowing bears to make a comeback.
At the time of writing, the 50 Simple Moving Average (SMA) support has been lost. Meanwhile, bulls are working like ants to defend the channel’s lower edge support. If this support is lost, Elrond will likely drop to the 100 SMA, currently at $150.
The Relative Strength Index has validated the bearish outlook on the hourly chart. Therefore, there is a chance the $150 support might be bypassed. Hence the 200 SMA holding at around $110 come to the bulls’ rescue.
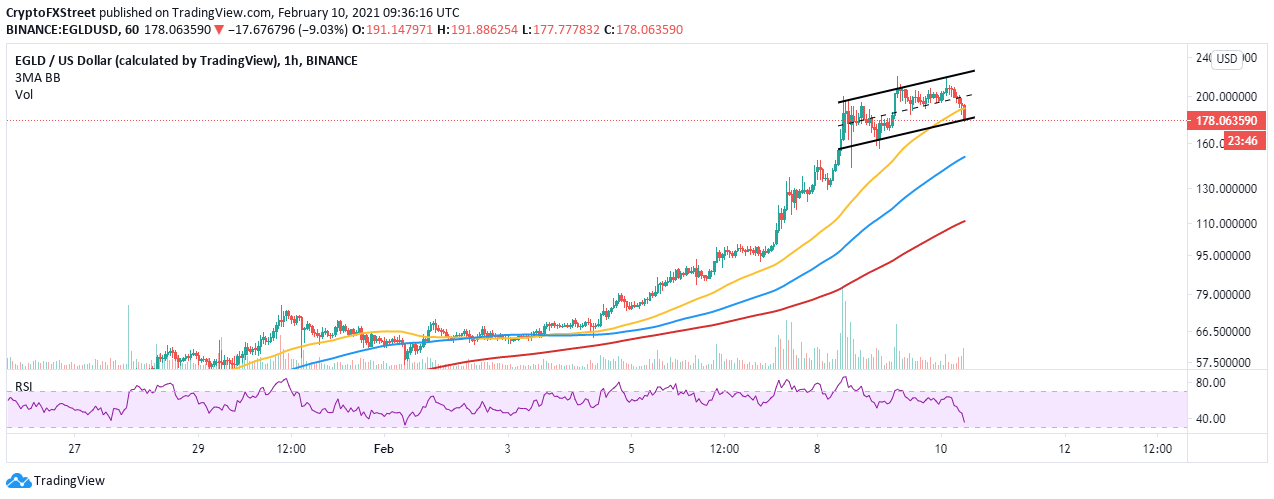
EGLD/USD 1-hour chart
The TD Sequential indicator has presented a sell signal on the daily chart, adding weight to the pessimistic outlook. If the impact of the call to sell continues, we can expect Elrond to fall further towards $100. Note that the RSI in this timeframe is overbought, hence the possibility of overhead pressure rising significantly.
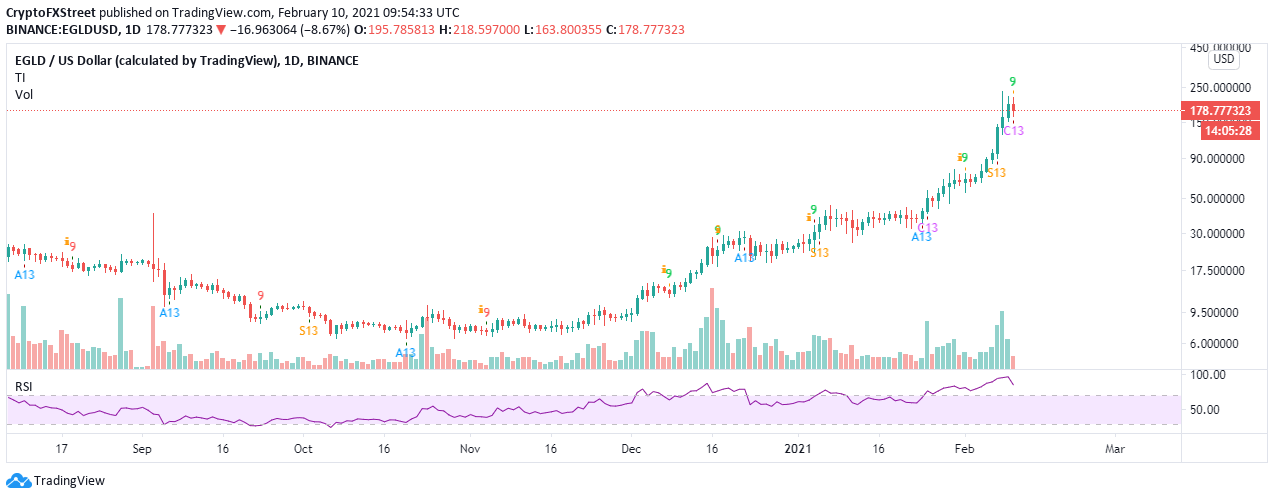
EGLD/USD daily chart
Looking at the other side of the fence
Elrond will abandon the bearish outlook altogether if the ascending channel lower boundary remains intact. A bounce from this level is likely to pull the price higher above $200. Moreover, a break above the record high at $220 will place the altcoin on another trajectory to new all-time highs targeting $300.
Author

John Isige
FXStreet
John Isige is a seasoned cryptocurrency journalist and markets analyst committed to delivering high-quality, actionable insights tailored to traders, investors, and crypto enthusiasts. He enjoys deep dives into emerging Web3 tren


