- Elrond price has dropped by 25% since the TD Sequential indicator presented a sell signal on the daily chart.
- The digital asset is right above a crucial support level on the 1-hour chart.
- If EGLD bulls can hold $161, Elrond can see a significant rebound towards $190.
Elrond had a massive bull rally during 2021 reaching an all-time high of $217 and a market capitalization of around $3.5 billion. After a massive run, the digital asset has experienced a significant 30% correction down to $147.
Elrond price is at the doors of a key support level
On the 1-hour chart, there is a critical support level formed at $161. So far, EGLD bulls have held this level as the current candlestick hasn’t closed below it. Losing this level can push Elrond price down to $129 which is the next significant support level.
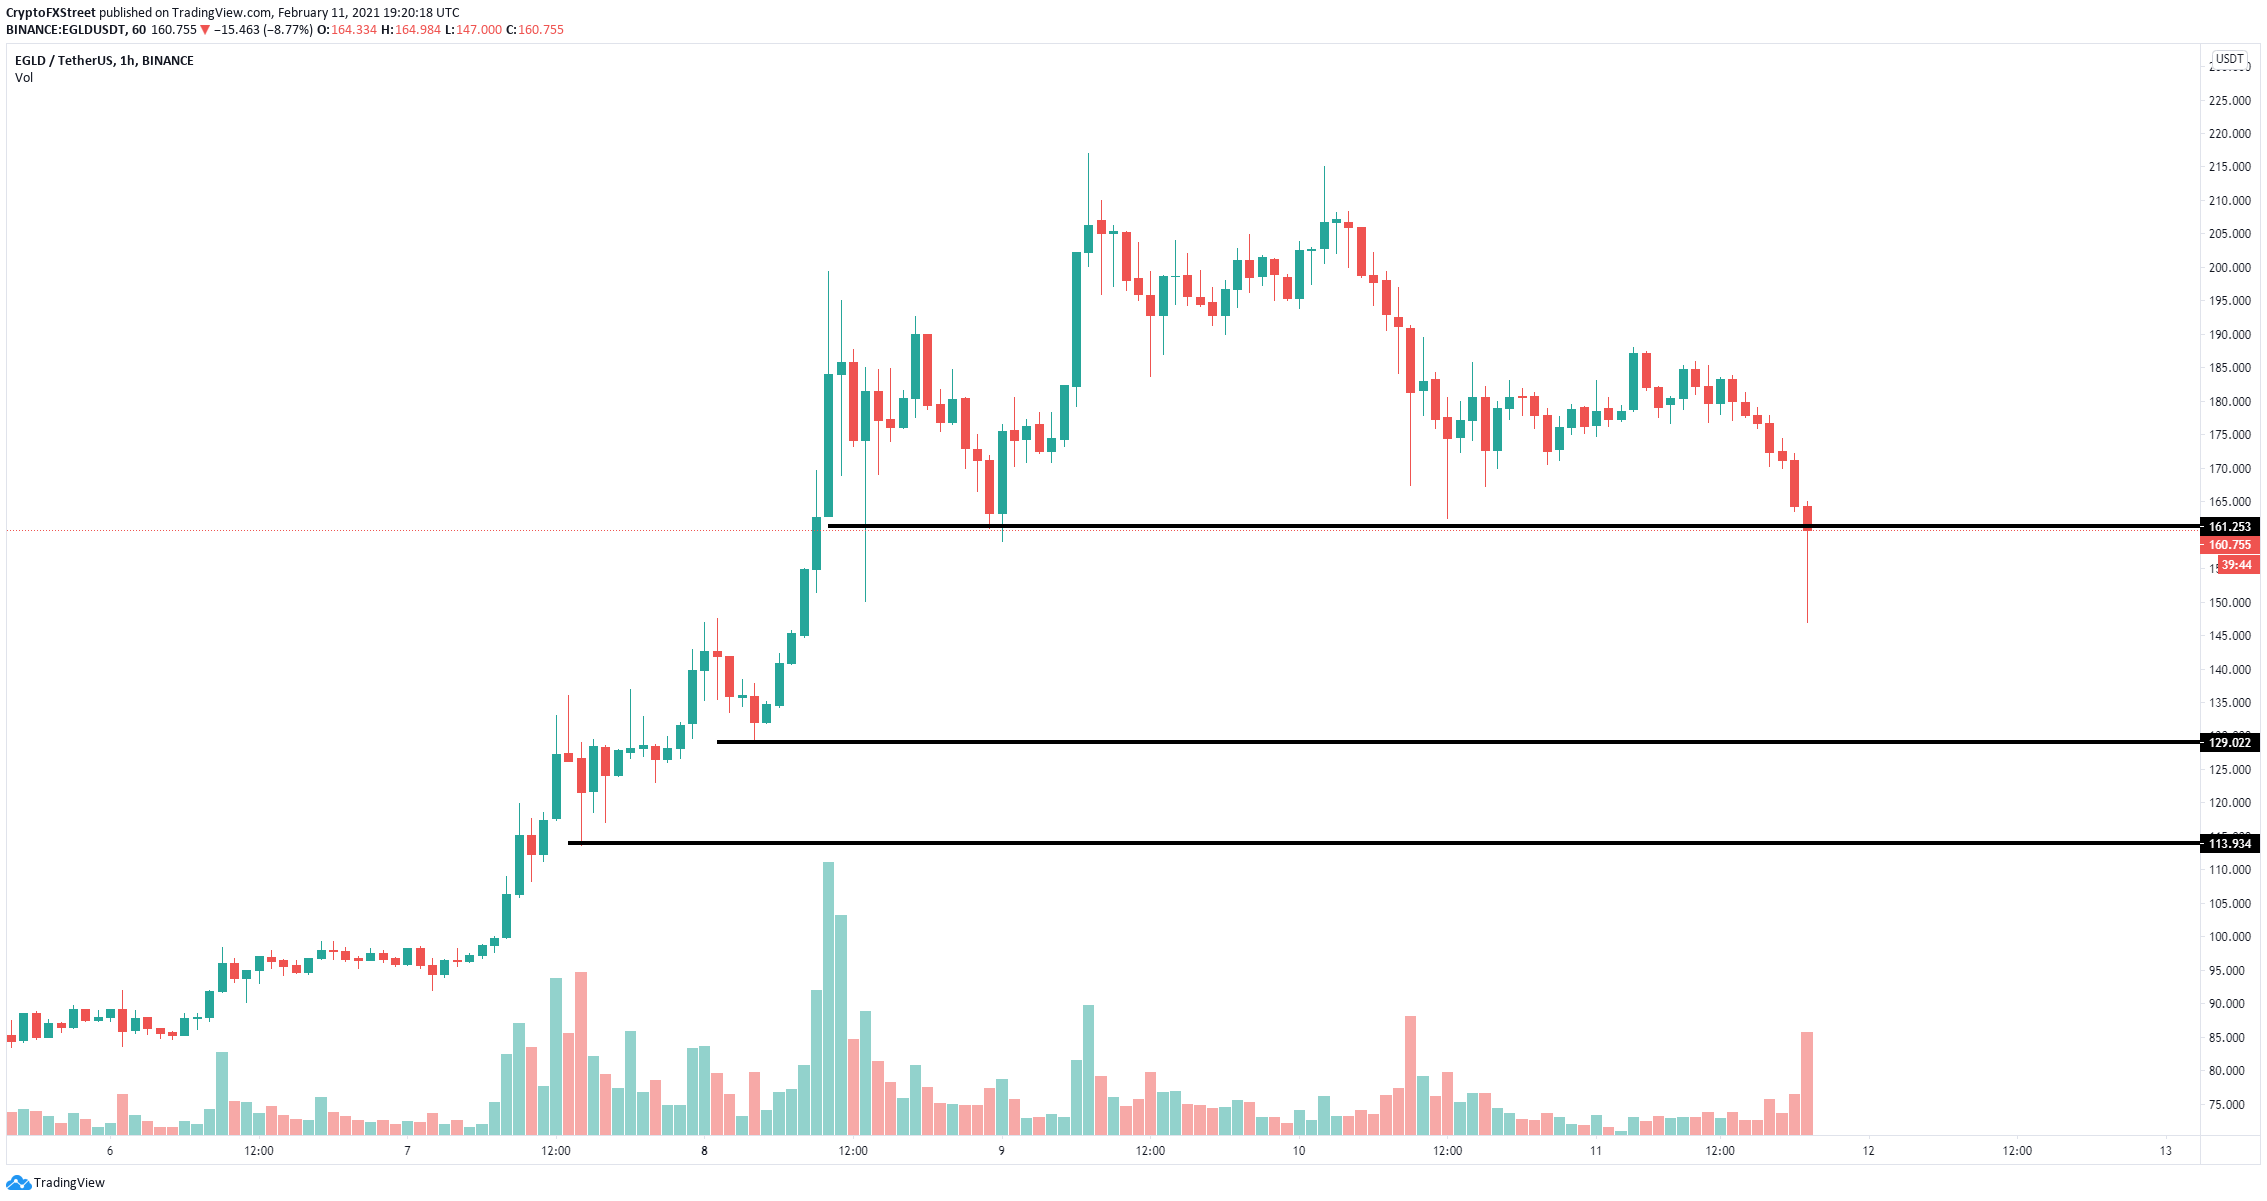
EGLD/USD 1-hour chart
On the daily chart, the TD Sequential indicator presented a sell signal on February 10 which is getting a lot of bearish continuation. Using the Fibonacci Retracement tool, we can find out potential price targets. The nearest is $143, which was hit already. The 50% Fib level is located at $121 which almost coincides with the $129 level stated above.
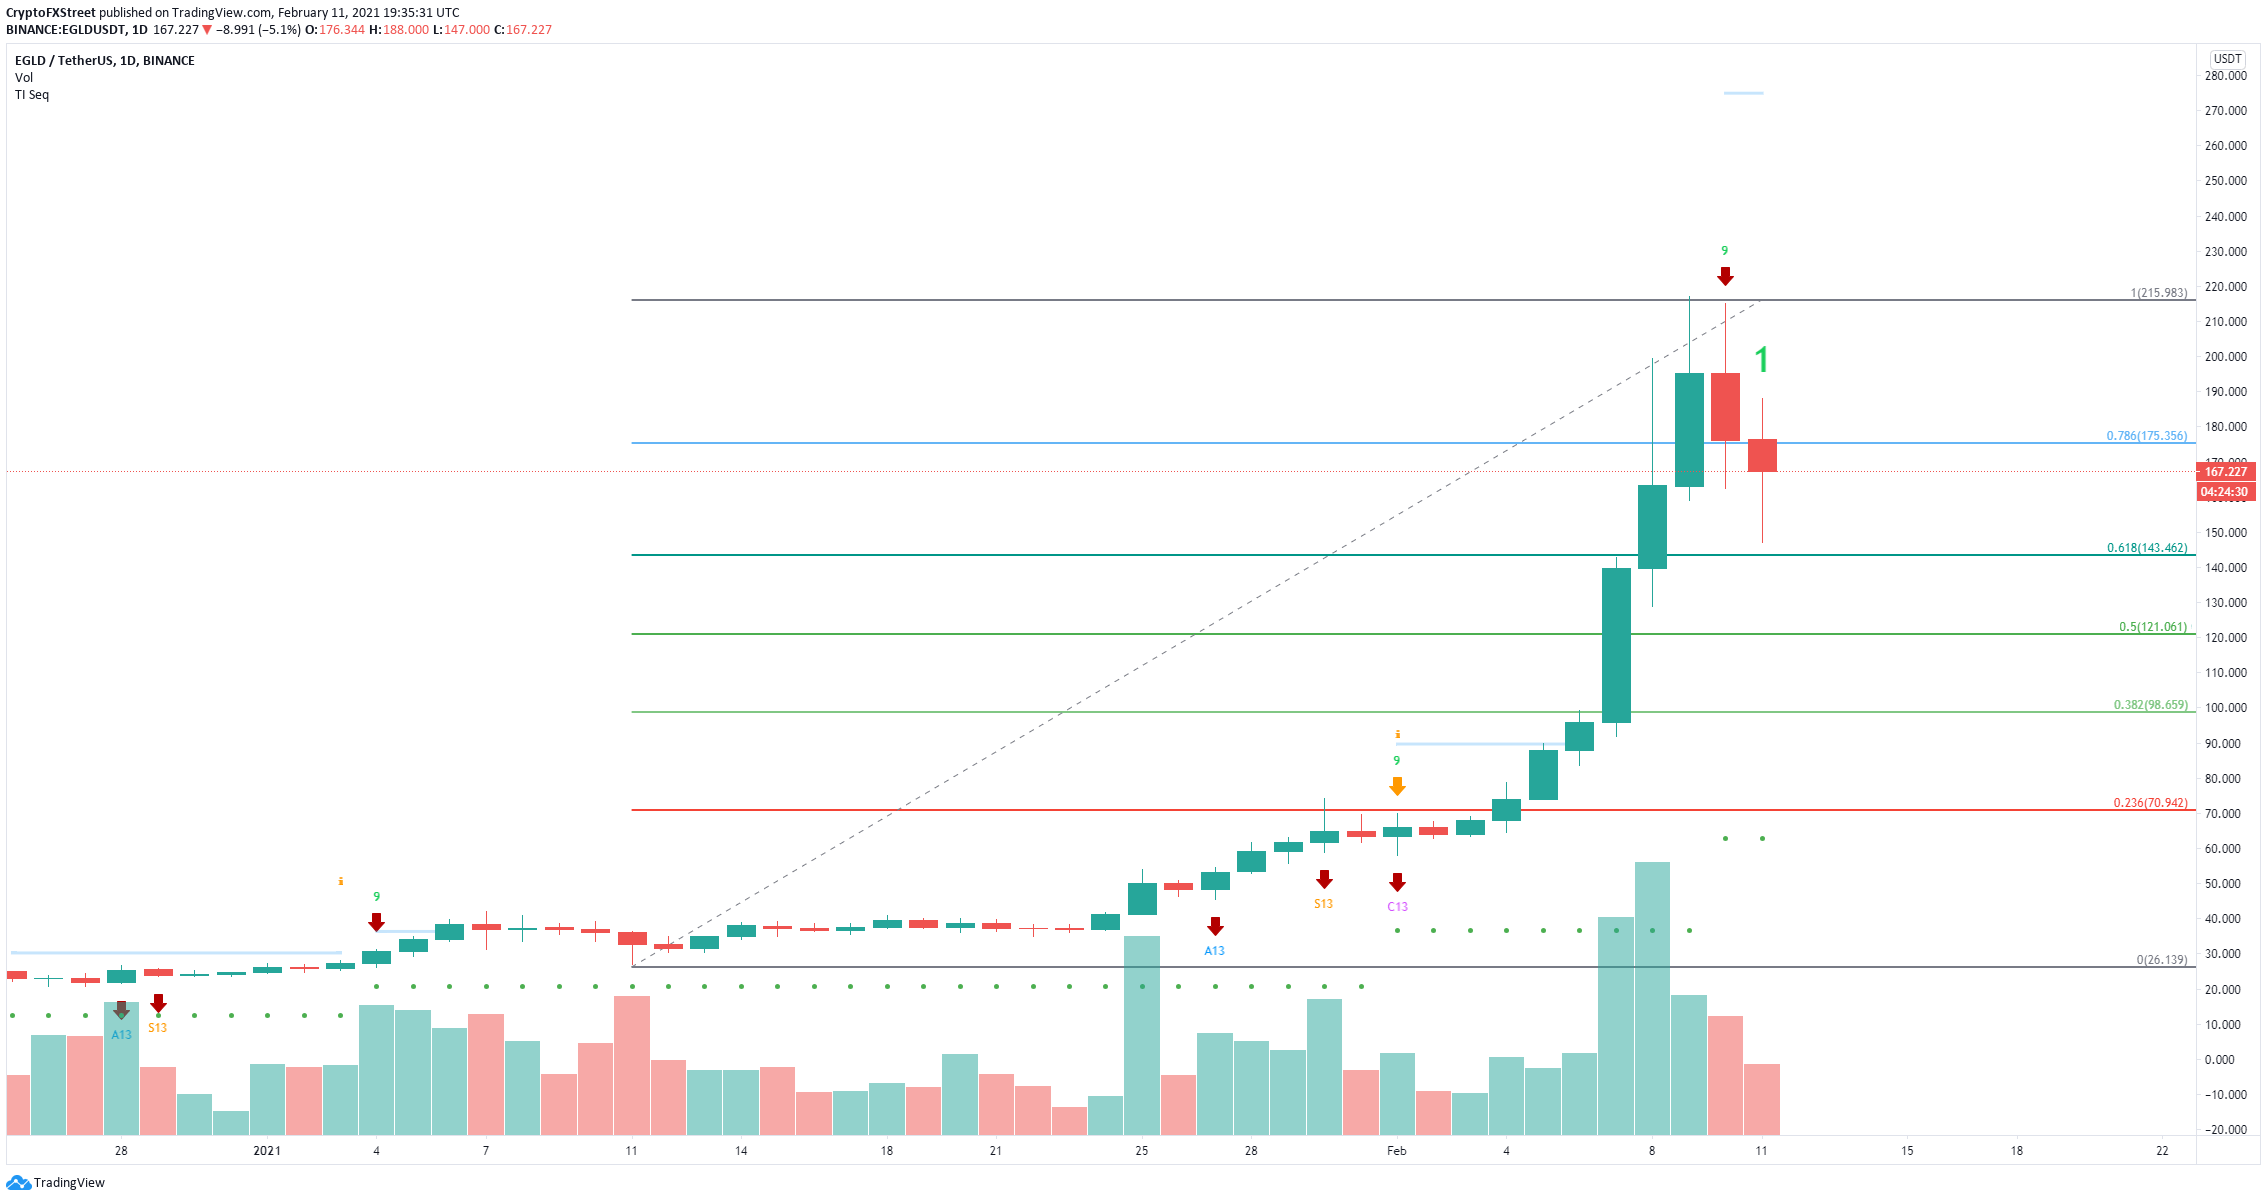
EGLD/USD daily chart
On the other hand, if the bulls can hold the critical support level at $161, the rebound could push Elrond price towards $190.
Note: All information on this page is subject to change. The use of this website constitutes acceptance of our user agreement. Please read our privacy policy and legal disclaimer. Opinions expressed at FXstreet.com are those of the individual authors and do not necessarily represent the opinion of FXstreet.com or its management. Risk Disclosure: Trading foreign exchange on margin carries a high level of risk, and may not be suitable for all investors. The high degree of leverage can work against you as well as for you. Before deciding to invest in foreign exchange you should carefully consider your investment objectives, level of experience, and risk appetite. The possibility exists that you could sustain a loss of some or all of your initial investment and therefore you should not invest money that you cannot afford to lose. You should be aware of all the risks associated with foreign exchange trading, and seek advice from an independent financial advisor if you have any doubts.
Recommended Content
Editors’ Picks
Ripple's move above this key level could trigger nearly 50% rally for XRP
Ripple has overcome a critical resistance level and flipped into a support floor on the weekly time frame. This development happened while XRP tightly consolidated for roughly 250 days. Investors can expect XRP to kickstart a massive rally.
Optimism price outlook with nearly $90 million worth of OP tokens flooding markets on Friday
Optimism volatility has shrunk in the ours leading to the network’s cliff unlock. It joins the likes of dYdX and Sui, which have similar events on their calendars. As token unlocks are often considered bearish catalysts, investors should brace for a reaction after the event.
Top 3 Price Prediction Bitcoin, Ethereum, Ripple: Retail watches from the sidelines with a bias for shorts
Bitcoin could clear $73,777 peak as BTC bulls resurface. Ethereum might fall 10% before next leg up as ETH RSI teases with sell signal. XRP could lose $0.6000 threshold as Ripple bulls fail to show up.
Jito price could hit $6 as JTO coils up inside this bullish pattern
Jito price action shows a potential cup and handle formation. Based on theoretical measurement rules, a successful breakout could yield a 56% rally to $6.0. A breakdown of the $3.86 support level would create a lower low for JTO and invalidate the bullish thesis.
Bitcoin: BTC may have recovered, but is it out of the woods?
Bitcoin’s (BTC) upward momentum has shown a significant decline for the past two weeks or so. This development led to a bearish signal on the weekly and an uncertain outlook on the monthly.