Don't believe the hype, the Shiba Inu price will pullback
- Shiba Inu price trades 65% above the June 13 low as the bulls aim to print a Shooting Star candlestick pattern on the weekly chart.
- Multiple technical indicators suggest a pullback will occur for the SHIB price.
- Invalidation of the downtrend lies at $0.00001425.

Shiba Inu price moves higher but traders should be aware of the bearish scenario.
Shiba Inu price is too early to call
Shiba Inu price trades at $0.00001133 as the bulls have ascended 65% since the June 13 lows at $0.00000788. Investors are in a frenzy as talks that a market bottom has been established for the notorious meme coin arises. The technicals show a five-wave impulse down, a textbook clue to look for when hunting for a discounted value. However, a few factors should be considered before jumping the gun from a long-term perspective.
Shiba Inu price does have more short-term upside potential with targets in the $0.00001350 level for an additional 30% gain. However, The SHIB price has yet to hurdle the Relative Strength index's support level or double bottom at a historic low on the weekly chart. The RSI suggests even if the SHIB price continues higher in the short term, a pullback will occur to balance the RSI's reading above the support level.
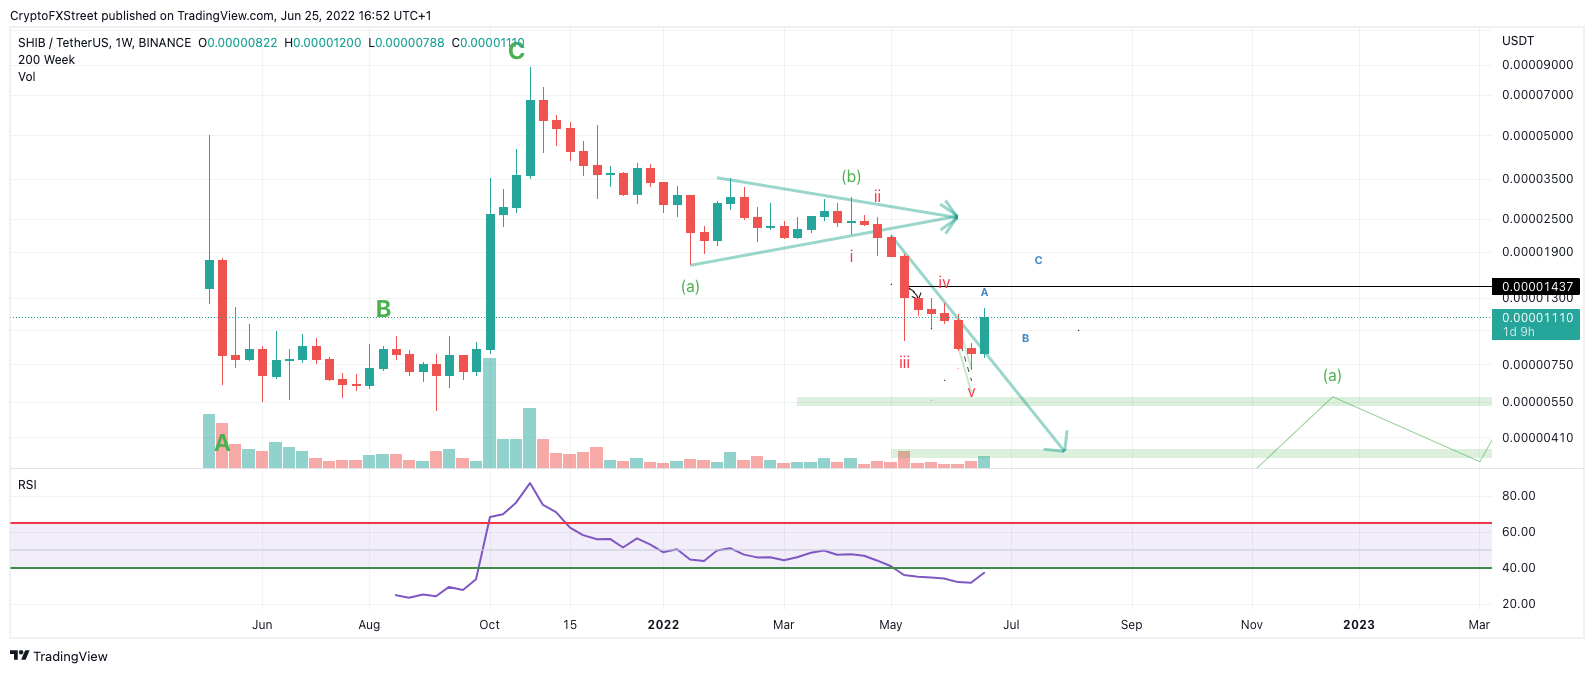
SHIB/USDT 1-Week Chart
SHIB price also lacks volume. There are still not enough transactions on the volume profile indicator to call a new bull run. If the technicals are correct, a short-term pullback could bring the SHIB price sub $0.00001000 before more upside ensues.
Invalidation of the bearish thesis is a breach above $0.00001437. If the bulls accomplish this hurdle, the bulls can confidently aim for an additional rally with targets in the $0.00001850 price zone resulting in a 66% increase from the current Shiba Inu price.
Author

Tony M.
FXStreet Contributor
Tony Montpeirous began investing in cryptocurrencies in 2017. His trading style incorporates Elliot Wave, Auction Market Theory, Fibonacci and price action as the cornerstone of his technical analysis.