Does technical analysis work with cryptocurencies? Part 3

If you missed them here are the links to part 1 and part 2.
In those two parts, I looked at chart patterns, the RSI, Stochastic and MACD indicators.
As this is such a broad subject it has to be broken into many parts and in this study, I will be looking at a few different chart types that we offer on the FXStreet chart tools section.
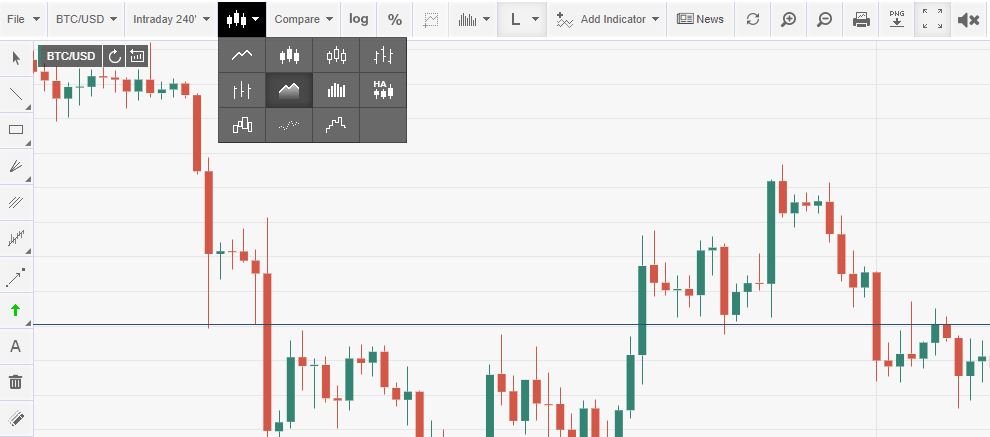
Once you are in there is a drop-down menu for chart types:
Here you can find: Candlesticks, Line, OLHC, Equivolume, Heikin-Ashi and Stair Step. The others are just variations of the others.
Candlestick Charts
Candlestick charts are probably the most common at the moment. I won't start explaining what they are and how they are formed If you want an explainer click here.
I just want to stick to how they are used in cryptocurrency trading. There are many types of candlestick patterns that you can research, I have listed a few below:
Hammer, Shooting start, Doji, Marabozu and then there are candle patterns which involve more than one candle. ie. abandoned baby, dark cloud cover, morning star, 3 bullish soldiers and we could go on and on.
What we really want to find out is how well they work with cryptocurrencies.
Before we begin I want you to think about what one daily candlestick represents.
One day is a fight between the bulls and the bears. The buyers and sellers. If the bulls win the candle is green if the bears win its red. If there is a shadow either side then the price didn't close at the lows or the highs.
First of all, we will be looking at hammer and shooting star candles. Example:
-637111730397231189.png)
We will focus on these two candles first and work out how many times they offer the correct bullish (Hammer) and Bearish (Shooting Star) signals.
The way we will work out the risk to reward is the length of the candle is the stop and 3 times the length is the target.
In terms of how you classify the candles, they must be preceding or at the end of a downtrend or uptrend.
Also, the shadow (wick) of the candle has to be 2 times the length of the body.
In this study, there were 14 losers and 6 winners at a one to three risk to reward ratio. So if each trade risked USD 100 then the winner came back with USD 300 profit.
USD 1800 won and USD 1400 lost that is a total of USD 400 profit over 20 trades.
Heiken Ashi Charts
If you need a tutorial in what Heiken Ashi charts are then click here.
Once again I will focus on if the charting system works with cryptocurrencies.
There are a few methods of trading with them but I will show you one simple and common way.
When the trend changes colour you must have two consecutive candles of the same colour before you take a trade.
ie. two reds or two greens once the trend has changed.
Example:
-637111750008291198.png)
This time I will be using daily candles in the ETH/USD pair.
Once again it will be a 1 to 3 risk to reward. and the stop loss will be at the previous wave high or low.
Over 20 trades:
12 trades lost and 8 trades won. So again its USD 100 per loss so USD 1200 and USD 2400. Total USD 1200 over 20 trades.
Conclusion
Choosing the right chart time is very important. Open high low close (OLHC) charts are very similar to candlesticks but Heikin Ashi are very different. I just showed you two very simple trading systems with both chart types but there are many many more.
In the next part, we will have a look at Equivolume charts and how they can be used and interpreted.
Author

Rajan Dhall, MSTA
FX Daily
Rajan Dhall is an experienced market analyst, who has been trading professionally since 2007 managing various funds producing exceptional returns.


