- Decentraland price is gearing up for a significant drop following a slice below a critical line of defense.
- MANA could be headed for $1.46 next, a target given by the prevailing chart pattern.
- Decentraland may discover meaningful support at $1.92 before the sell-off continues.
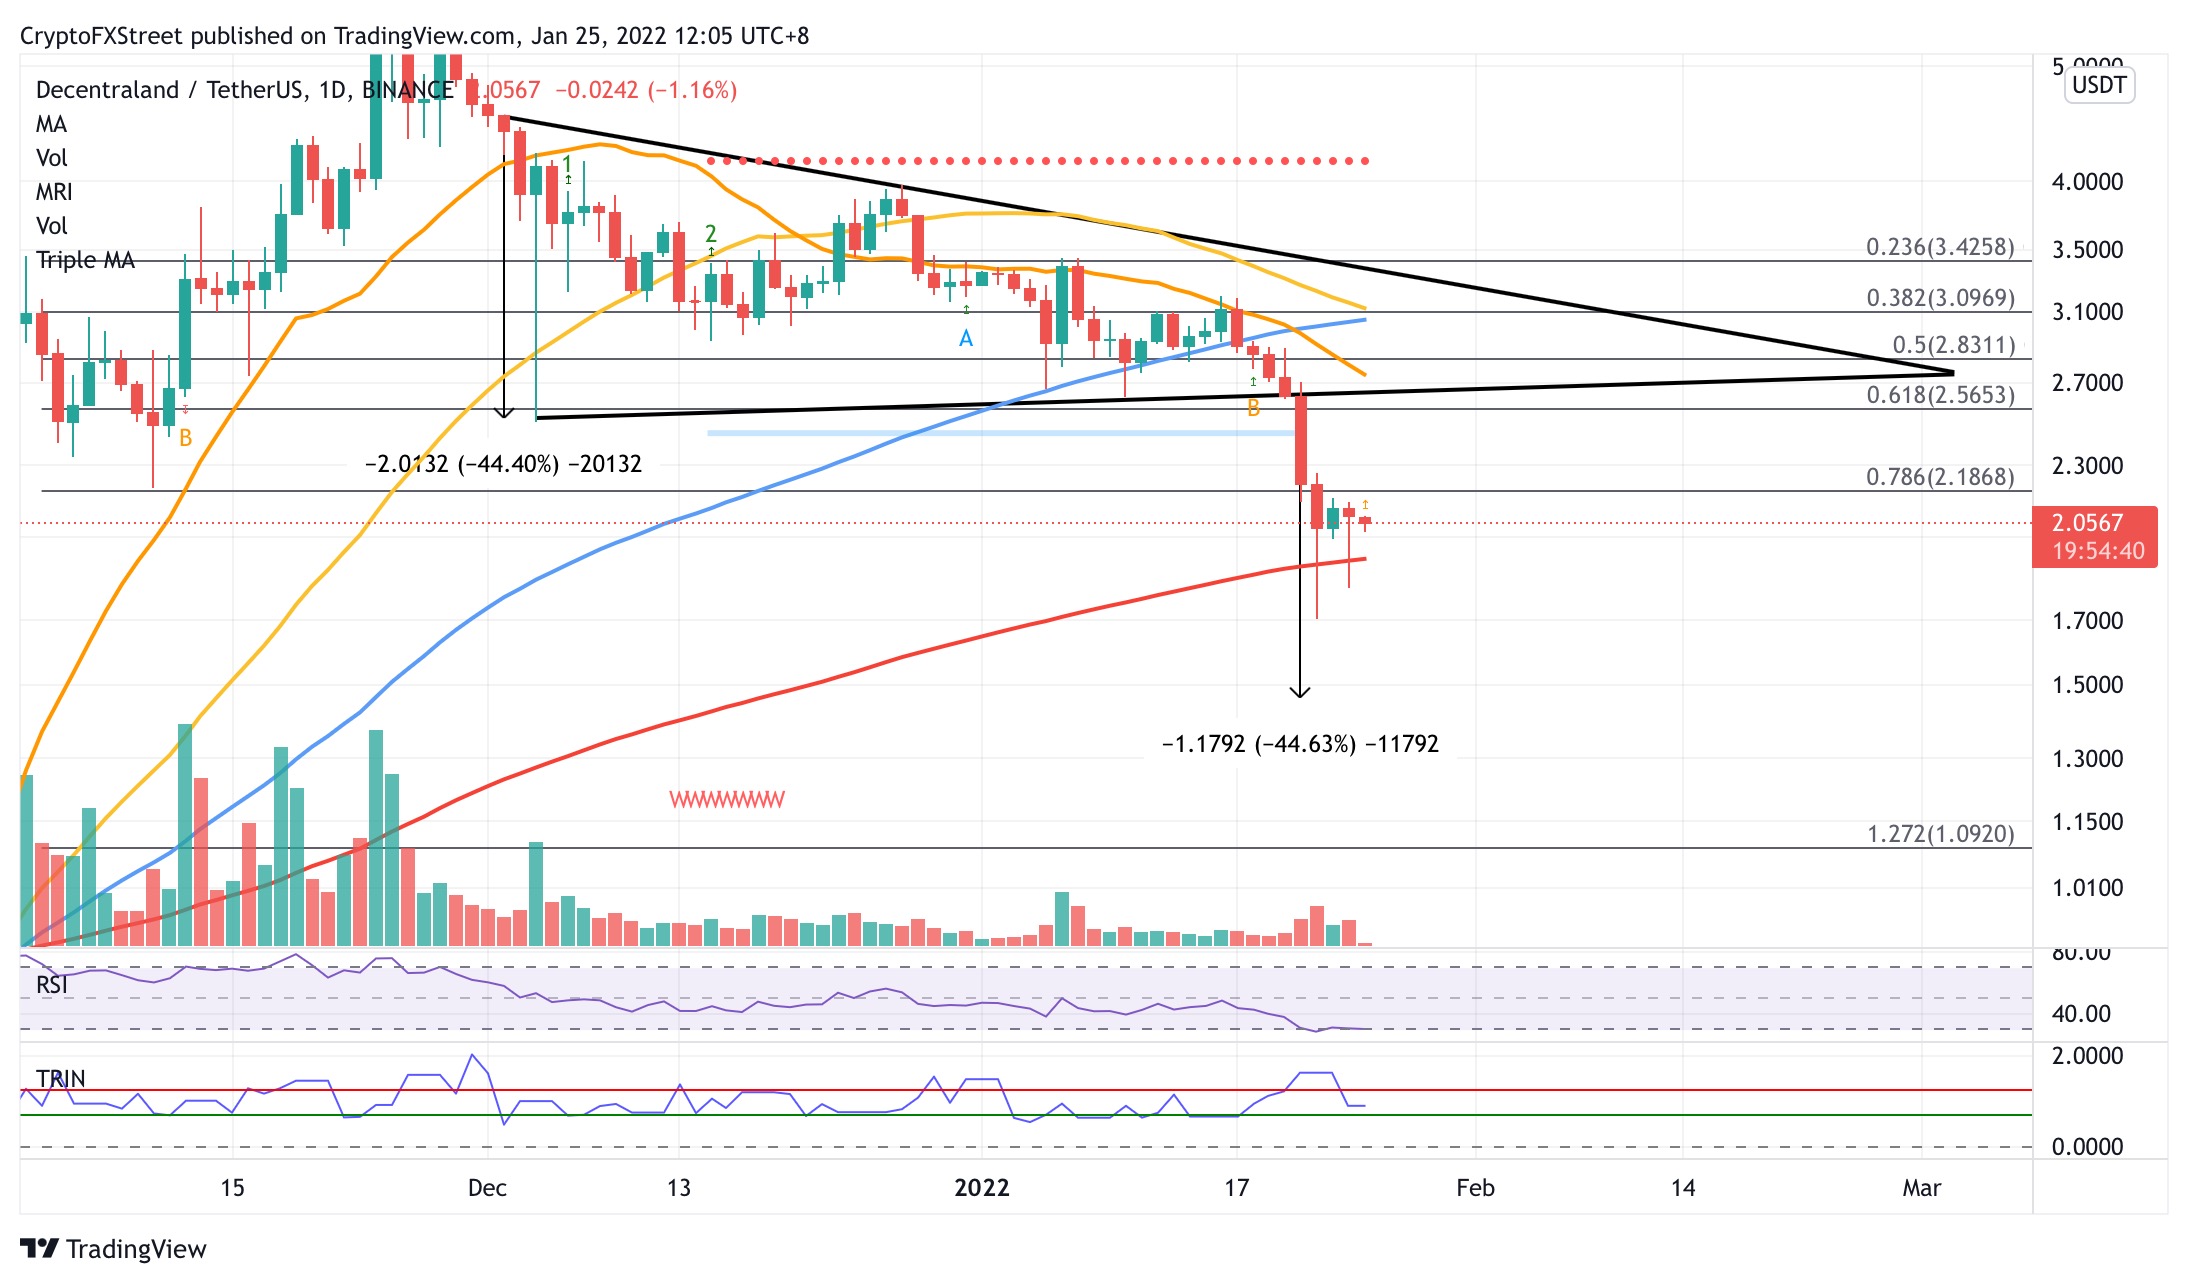
Decentraland price could be headed for a further decline as MANA continues to drop toward the bearish target projected by a pessimistic chart pattern. The token is at risk of a 28% plunge toward $1.46 if the 200-day Simple Moving Average (SMA) fails to act as a reliable foothold.
Decentraland price searches for meaningful support
Decentraland price has formed a descending triangle pattern on the daily chart, putting a 44% nosedive toward $1.46 on the radar after MANA sliced below the lower boundary of the governing technical pattern on January 21.
The token could continue dropping further as Decentraland price fell below the 78.6% Fibonacci retracement level at $2.18 on January 22 which acted as a line of defense for MANA.
Decentraland price should be able to tread above the 200-day SMA at $1.92, which acts as the next line of defense for MANA.
However, dropping below the aforementioned level of support may spell further trouble for the bulls, as the token is likely to fall further to reach the bearish target at $1.46, coinciding with the October 29 high.
Additional selling pressure may see Decentraland price plunge further toward the 127.2% Fibonacci extension level at $1.09.
MANA/USDT daily chart
If buying pressure increases, Decentraland price will face immediate support-turned resistance at the 78.6% Fibonacci retracement level at $2.18, then at the lower boundary of the governing technical pattern at $2.64, which sits near the 61.8% Fibonacci retracement level and 21-day SMA.
Decentraland price may be confronted with a stiff hurdle at $3.09, where the 38.2% Fibonacci retracement level is located. Padding this resistance is the 50-day SMA and 100-day SMA. Only a decisive break above this headwind would see MANA target bigger aspirations above the upper boundary of the prevailing chart pattern.
Note: All information on this page is subject to change. The use of this website constitutes acceptance of our user agreement. Please read our privacy policy and legal disclaimer. Opinions expressed at FXstreet.com are those of the individual authors and do not necessarily represent the opinion of FXstreet.com or its management. Risk Disclosure: Trading foreign exchange on margin carries a high level of risk, and may not be suitable for all investors. The high degree of leverage can work against you as well as for you. Before deciding to invest in foreign exchange you should carefully consider your investment objectives, level of experience, and risk appetite. The possibility exists that you could sustain a loss of some or all of your initial investment and therefore you should not invest money that you cannot afford to lose. You should be aware of all the risks associated with foreign exchange trading, and seek advice from an independent financial advisor if you have any doubts.
Recommended Content
Editors’ Picks
Ripple's move above this key level could trigger nearly 50% rally for XRP
Ripple has overcome a critical resistance level and flipped into a support floor on the weekly time frame. This development happened while XRP tightly consolidated for roughly 250 days. Investors can expect XRP to kickstart a massive rally.
Optimism price outlook with nearly $90 million worth of OP tokens flooding markets on Friday
Optimism volatility has shrunk in the ours leading to the network’s cliff unlock. It joins the likes of dYdX and Sui, which have similar events on their calendars. As token unlocks are often considered bearish catalysts, investors should brace for a reaction after the event.
Top 3 Price Prediction Bitcoin, Ethereum, Ripple: Retail watches from the sidelines with a bias for shorts
Bitcoin could clear $73,777 peak as BTC bulls resurface. Ethereum might fall 10% before next leg up as ETH RSI teases with sell signal. XRP could lose $0.6000 threshold as Ripple bulls fail to show up.
Jito price could hit $6 as JTO coils up inside this bullish pattern
Jito price action shows a potential cup and handle formation. Based on theoretical measurement rules, a successful breakout could yield a 56% rally to $6.0. A breakdown of the $3.86 support level would create a lower low for JTO and invalidate the bullish thesis.
Bitcoin: BTC may have recovered, but is it out of the woods?
Bitcoin’s (BTC) upward momentum has shown a significant decline for the past two weeks or so. This development led to a bearish signal on the weekly and an uncertain outlook on the monthly.