Solana Price Forecast: SOL strikes key resistance with double-digit gains
- Solana approaches $90, poised for a potential upside breakout from a consolidation range after an 11% jump the previous day.
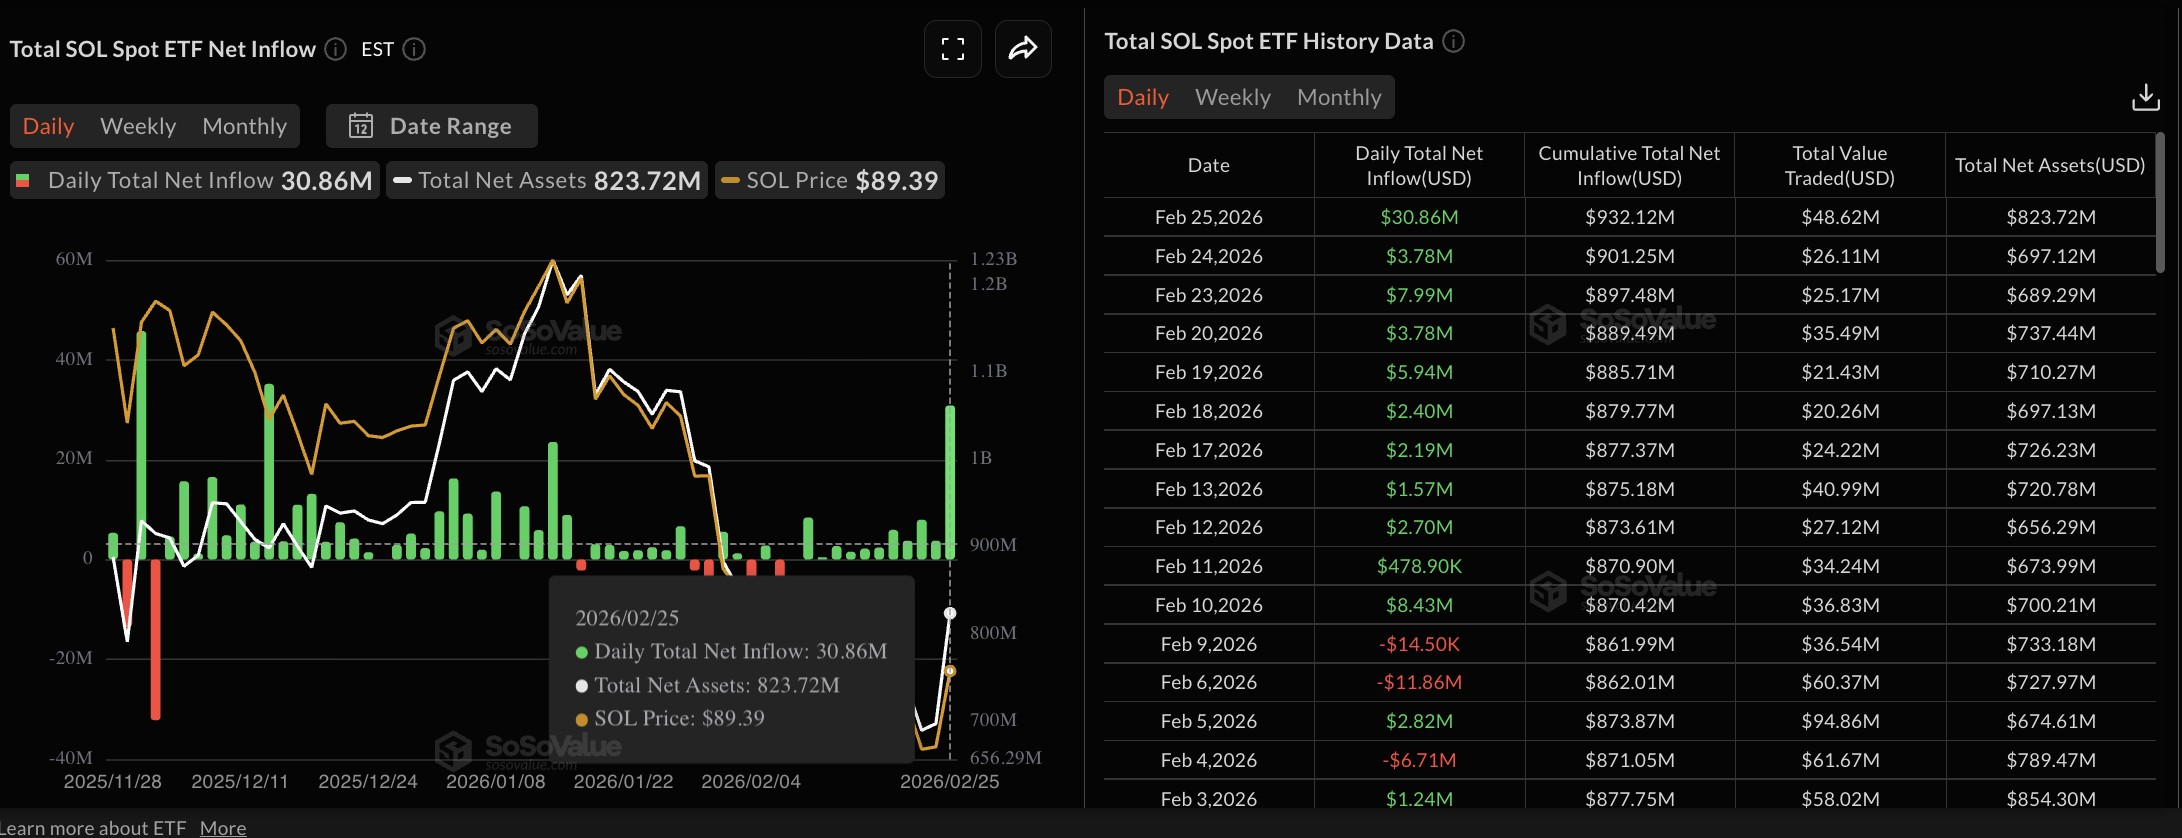
- US spot Solana ETFs record an inflow of $30 million on Wednesday, the largest since December 15.
- A surge in SOL futures Open Interest and funding rate suggests a rise in retail interest as the broader market rebounds.

Solana (SOL) trades at $88 at press time on Thursday, after an 11% upswing the previous day within a broader consolidation range of roughly three weeks. Institutional demand for Solana heightens as US spot SOL Exchange Traded Funds (ETFs) record $30 million of inflow on Wednesday. Retail demand catches up as Solana derivatives witness a 7% rise in futures Open Interest and a positive spike in funding rate.
Technically, Solana regains momentum, increasing the chances of a bullish breakout of the range-bound movement.
Retail demand for Solana catches up with institutional conviction
The institutional demand for Solana remained steady during the rough patch over the past three weeks amid broader market volatility. SOL spot ETFs recorded $30.86 million of daily net inflow on Wednesday, expanding holdings for the 11th consecutive day of inflows to a total net asset of $823.72 million.
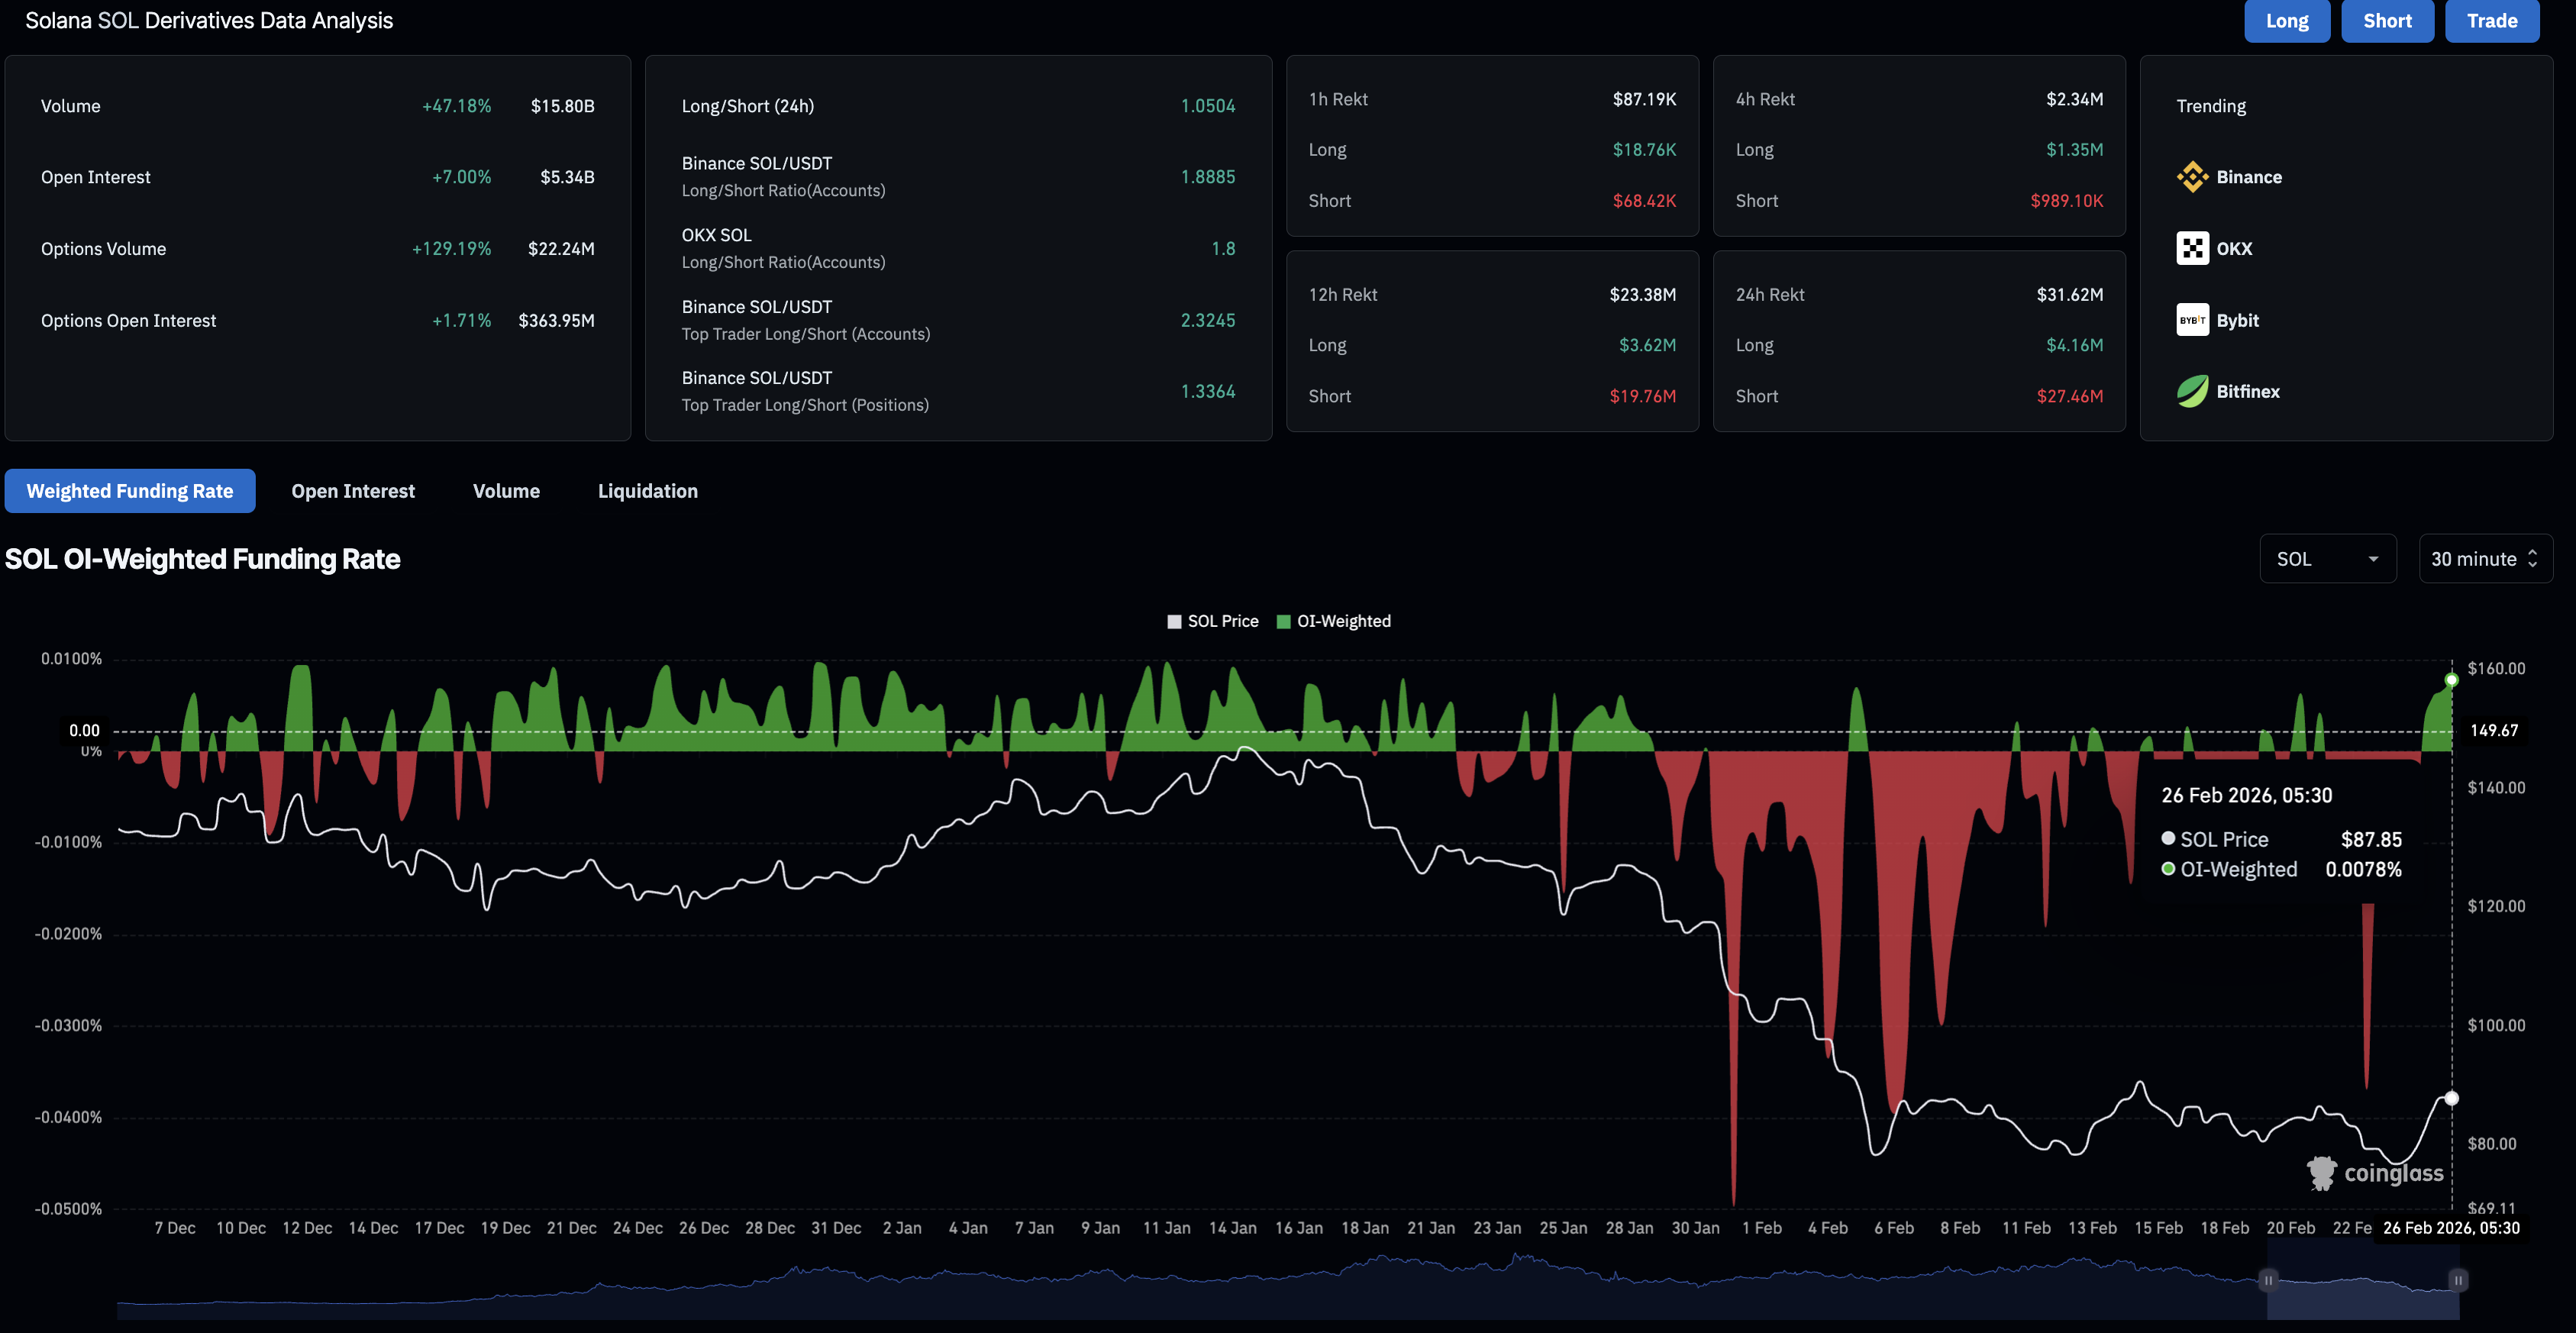
On the derivatives side, CoinGlass data shows that SOL futures Open Interest (OI) is at $5.34 billion on Thursday, up 7% in the last 24 hours, suggesting an increase in the notional value of outstanding contracts as traders either build more positions or increase leverage. Typically, an increase in OI reflects traders' interest in a decisive move that could go either way.
In the case of Solana, the funding rate turning positive to 0.0078%, up from roughly -0.0040% the previous day, reflects a significant increase in bullish interest for a positional build-up.
Additionally, the short liquidations of $27.46 million over the past 24 hours are significantly more than long liquidations of $4.16 million, reflecting a wipeout of bearish positions. This has left a greater number of active bullish positions in the market, evidenced by the long-to-short ratio of 1.0540.
A bullish shift in the derivatives market sentiment, catching up with steady institutional demand, suggests a potentially strong rally in Solana.
Technical outlook: Will Solana price cross above $100?
Solana is up 1% at press time on Thursday, extending the gains for the third consecutive day. The recovery marks an upswing within a consolidation zone broadly within the February 5 price range from the $77.60 low to the $93.43 high.
The near-term bias is neutral with a mild bullish tilt as price approaches the $93.43 resistance level. However, SOL trades below the 50-day Exponential Moving Average (EMA), which could cap the broader rebound.
The Moving Average Convergence Divergence (MACD) histogram turns increasingly positive with the MACD and the signal line rising toward the zero line, suggesting heightened bullish momentum. The Relative Strength Index (RSI) at 47 remains below the 50 midline but has risen from oversold territory, suggesting fading bearish pressure.
If SOL exceeds $93.43, the 50-day EMA at $101.86 could serve as the initial resistance, followed by the December 18 low at $116.
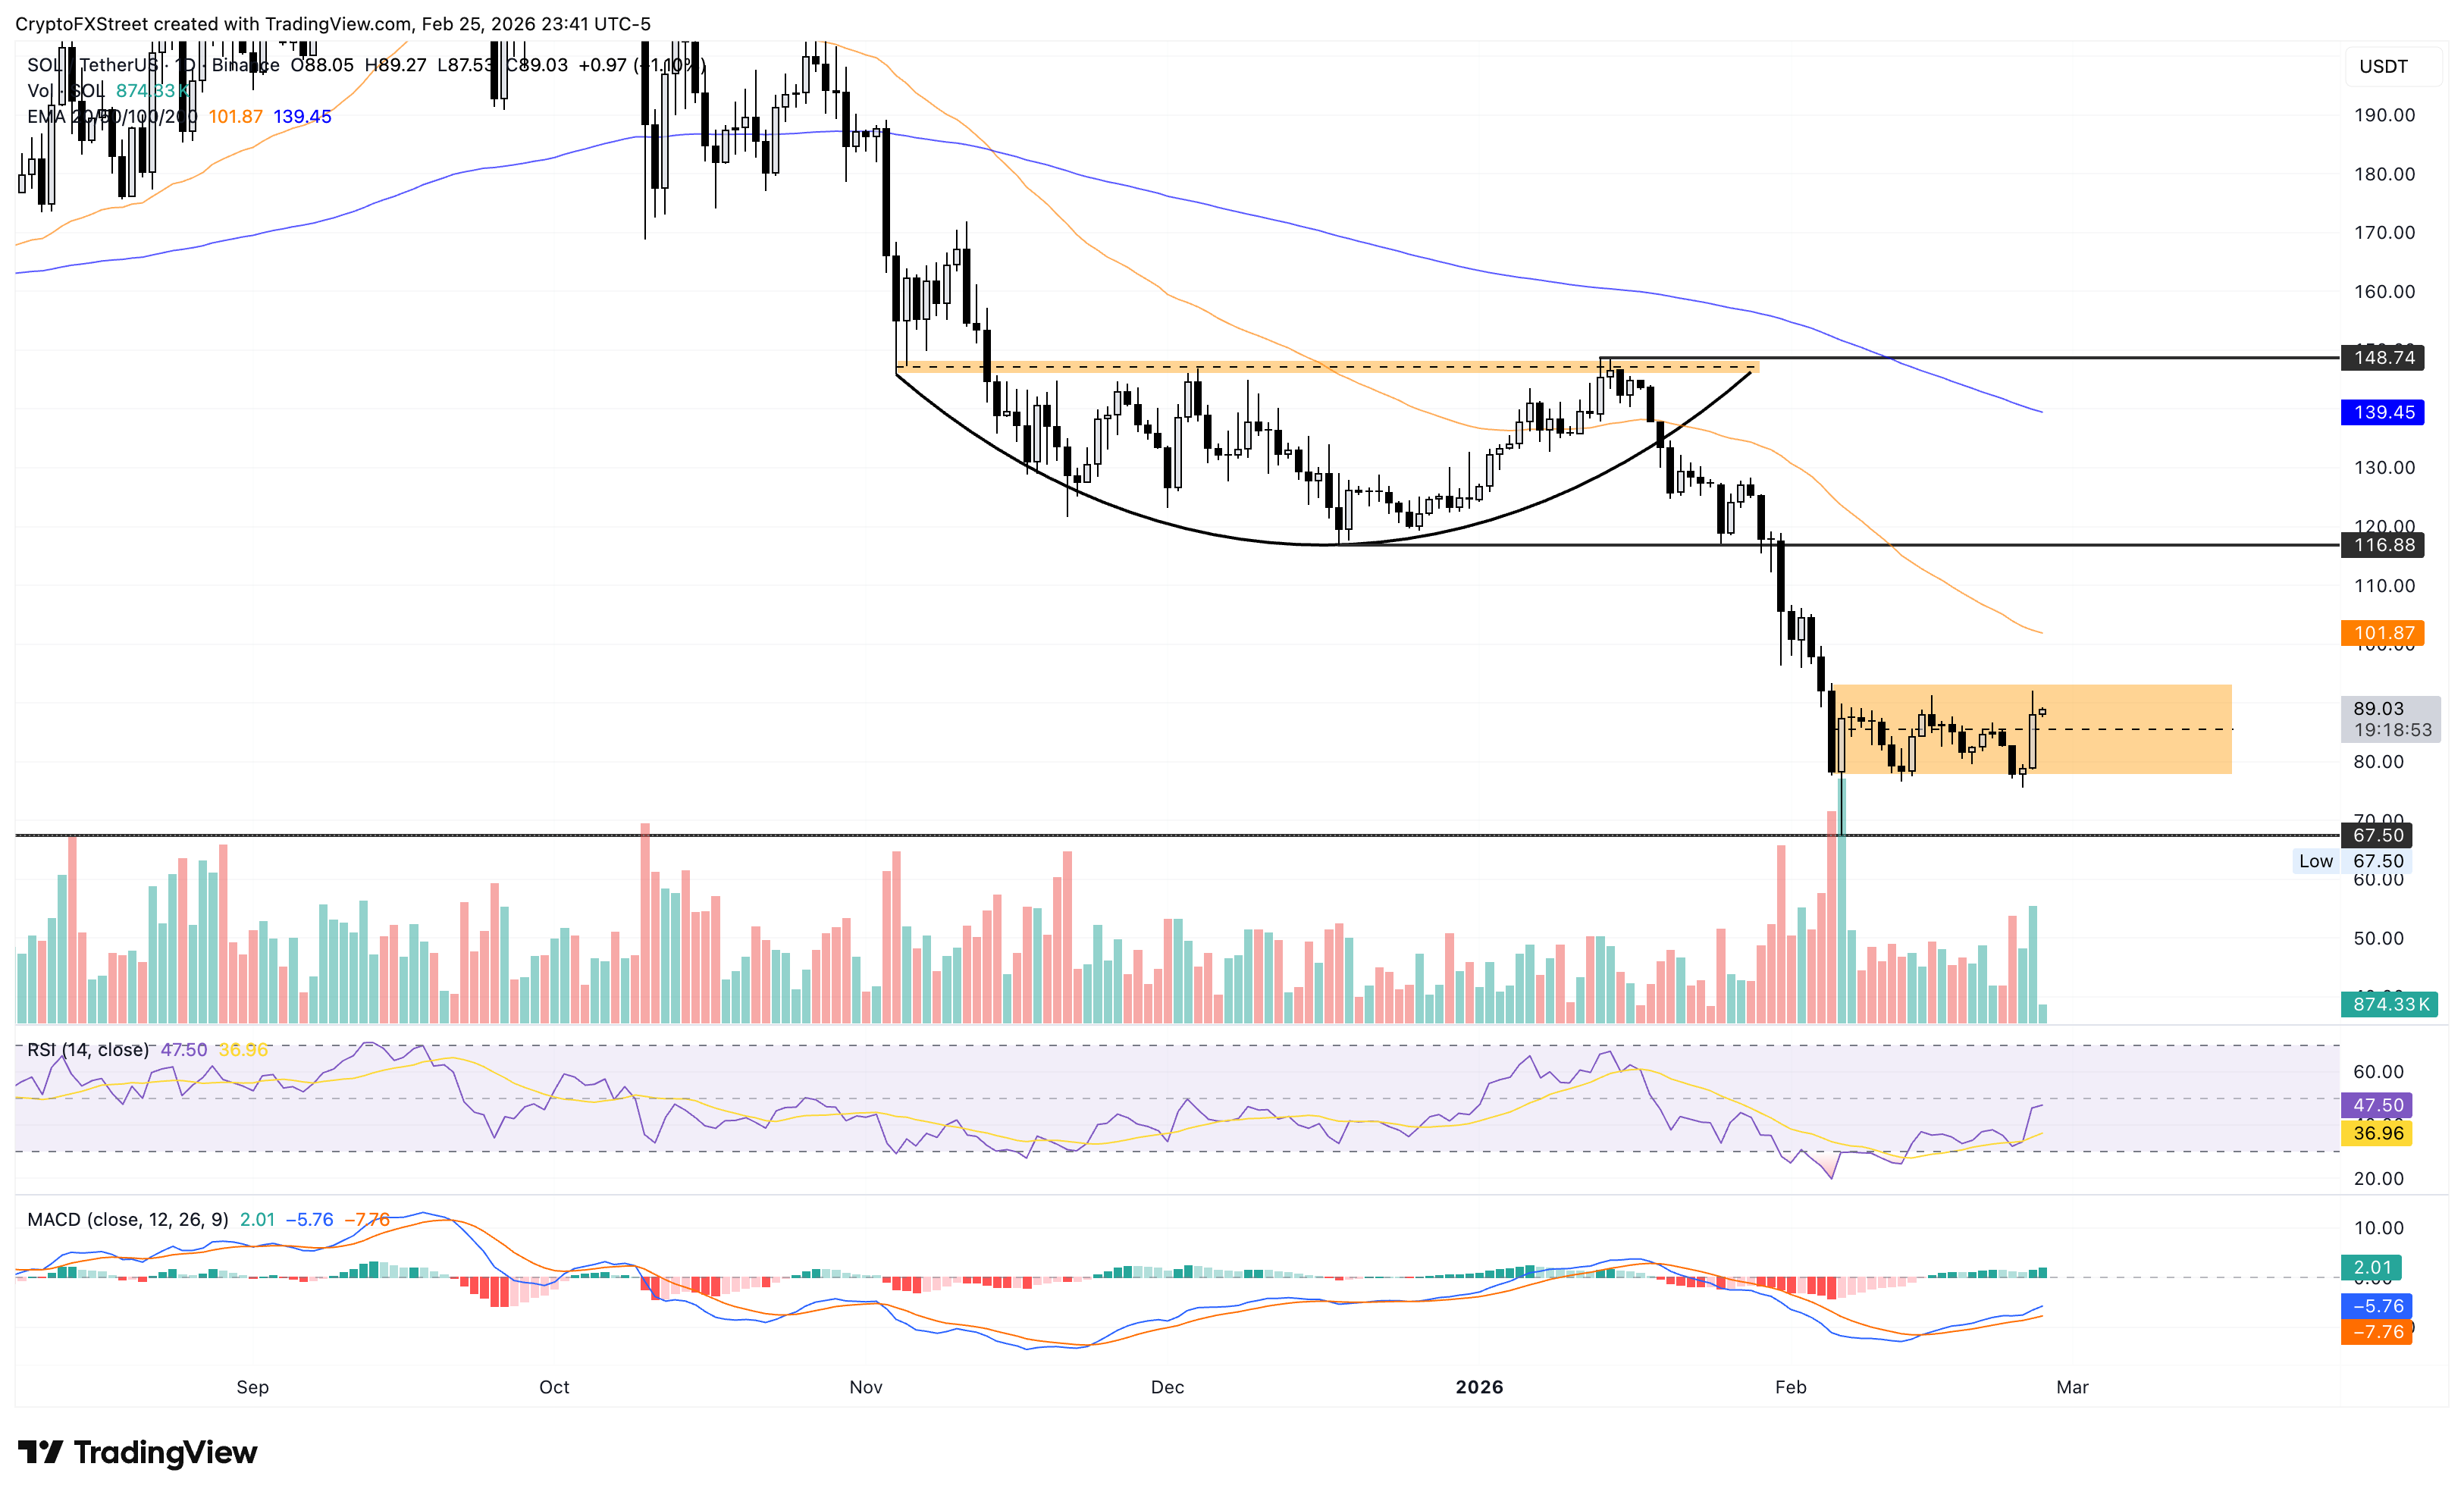
On the downside, the $77.60 support floor remains a crucial demand zone that could absorb renewed supply pressure. Still, a break below this area would expose the more distant support marked by the February 6 low at $67.50.
(The technical analysis of this story was written with the help of an AI tool.)
Author

Vishal Dixit
FXStreet
Vishal Dixit holds a B.Sc. in Chemistry from Wilson College but found his true calling in the world of crypto.



