Dash Price Forecast: Bearish momentum grows as $50 level comes into sight
- Dash extends the decline below the 50-day EMA, risking a drop to $50.
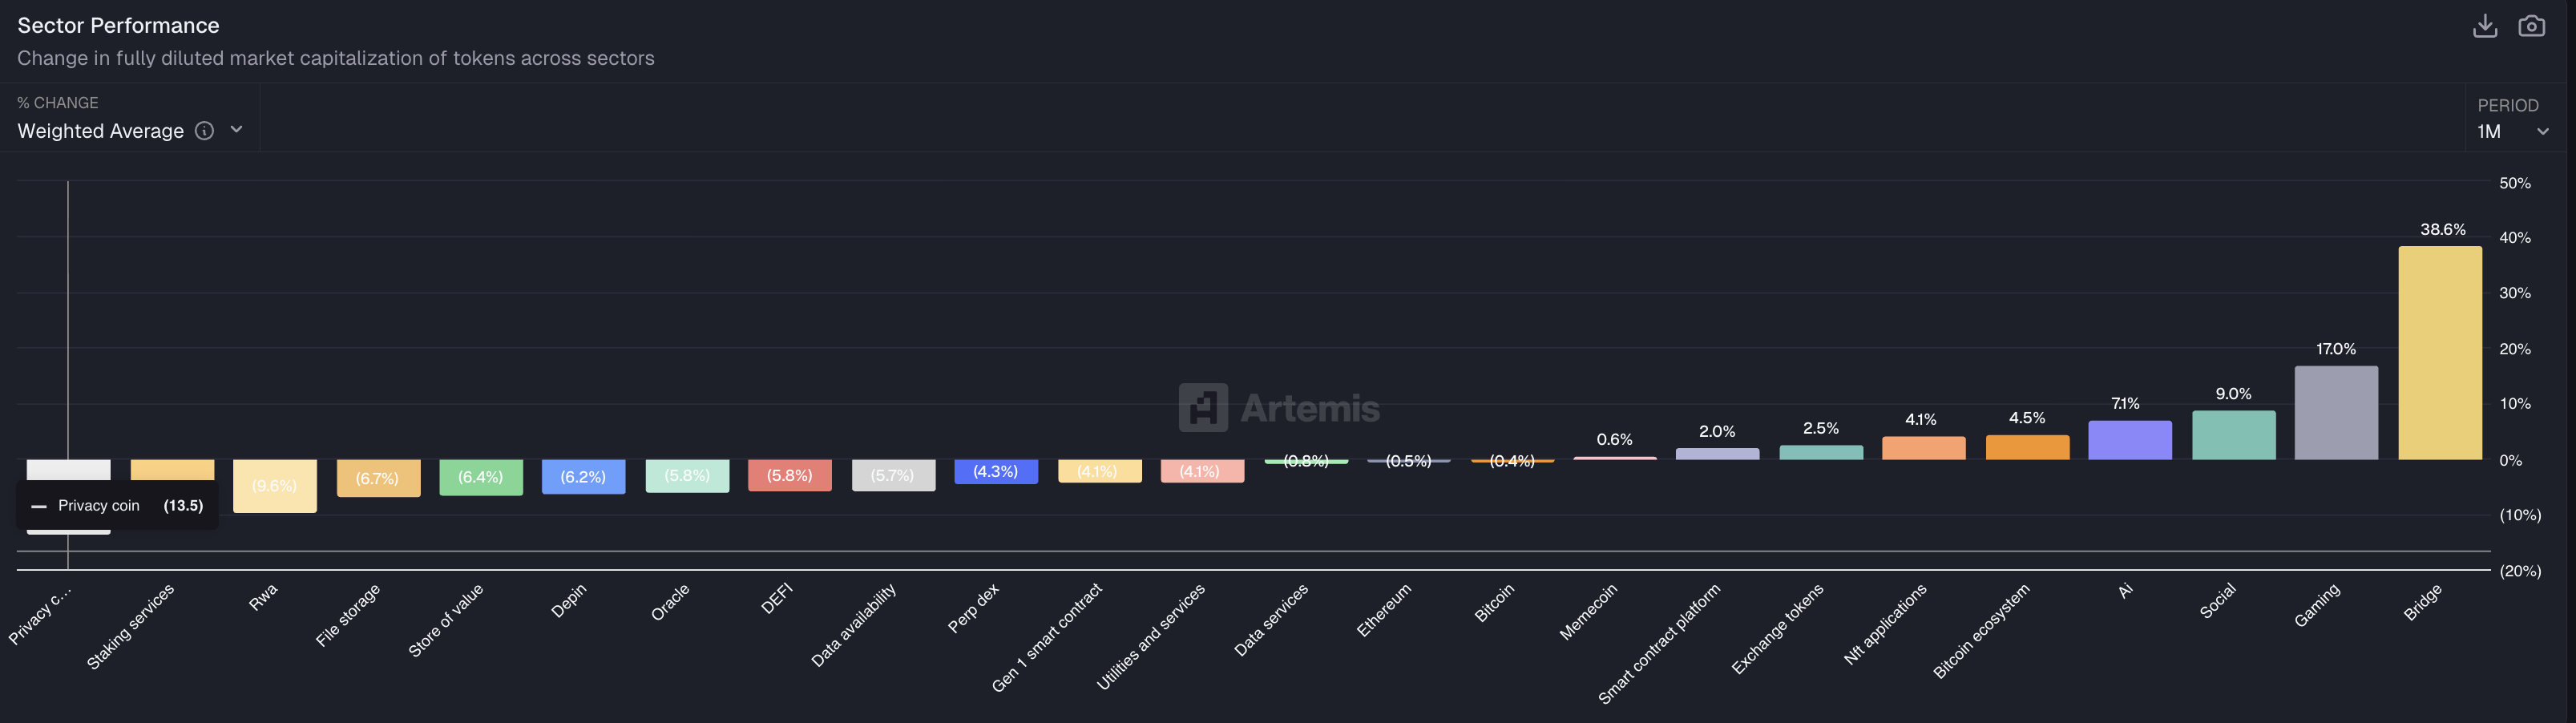
- Privacy coins are the worst-performing sector over the last month, signaling a sectoral capital shift.
- Declining Open Interest and liquidations of over $1 million in longs indicate a clear bearish bias.

Dash (DASH) faces intense headwinds, recording a 3% drop at press time on Thursday and extending a broader two-week decline that puts the key 50-day Exponential Moving Average (EMA) at $55.93 into the spotlight. The cooling-off in demand for privacy coins has made these tokens the worst-performing asset class in the cryptocurrency market over the last month. In DASH's case, the double-digit capital outflows seen in the derivatives market due to large long liquidations suggest reduced investors' interest.
Retail demand shifts away from privacy coins
Artemis data show that privacy coins are among the hardest-hit segments in the crypto market, recording an over 13% drop over the last month. This pullback signals a cool-down following the massive rally in late 2025 and earlier this month.
On the derivatives side, DASH futures Open Interest (OI) declined 13.69% over the last 24 hours to $105.31 million, indicating capital outflows primarily driven by long liquidations and risk-off sentiment. Long liquidations over the last 24 hours totaled $1.19 million, outpacing short liquidations of $52,910, reaffirming the bearish incline.

Dash risks a steeper correction to $50
Dash is down roughly 40% over the last two weeks, approaching the 50-day EMA at $55.93, where bulls are trying to limit further losses. Still, the 50-day EMA remains above the 200-day EMA.
If DASH closes the day below $55.93, it would likely extend the decline to the $50 psychological support level, near the 23.6% Fibonacci retracement at $49.39, measured from the November 4 high at $150.00 to the December 19 low at $35.04.
Technical indicators on the daily chart indicate rising bearish momentum. The Moving Average Convergence Divergence (MACD) shows the blue and red lines falling toward zero as the negative histogram widens. The Relative Strength Index (RSI) is at 46, slipping from the neutral region with a downward tilt, siganling early stage of increasing selling pressure.
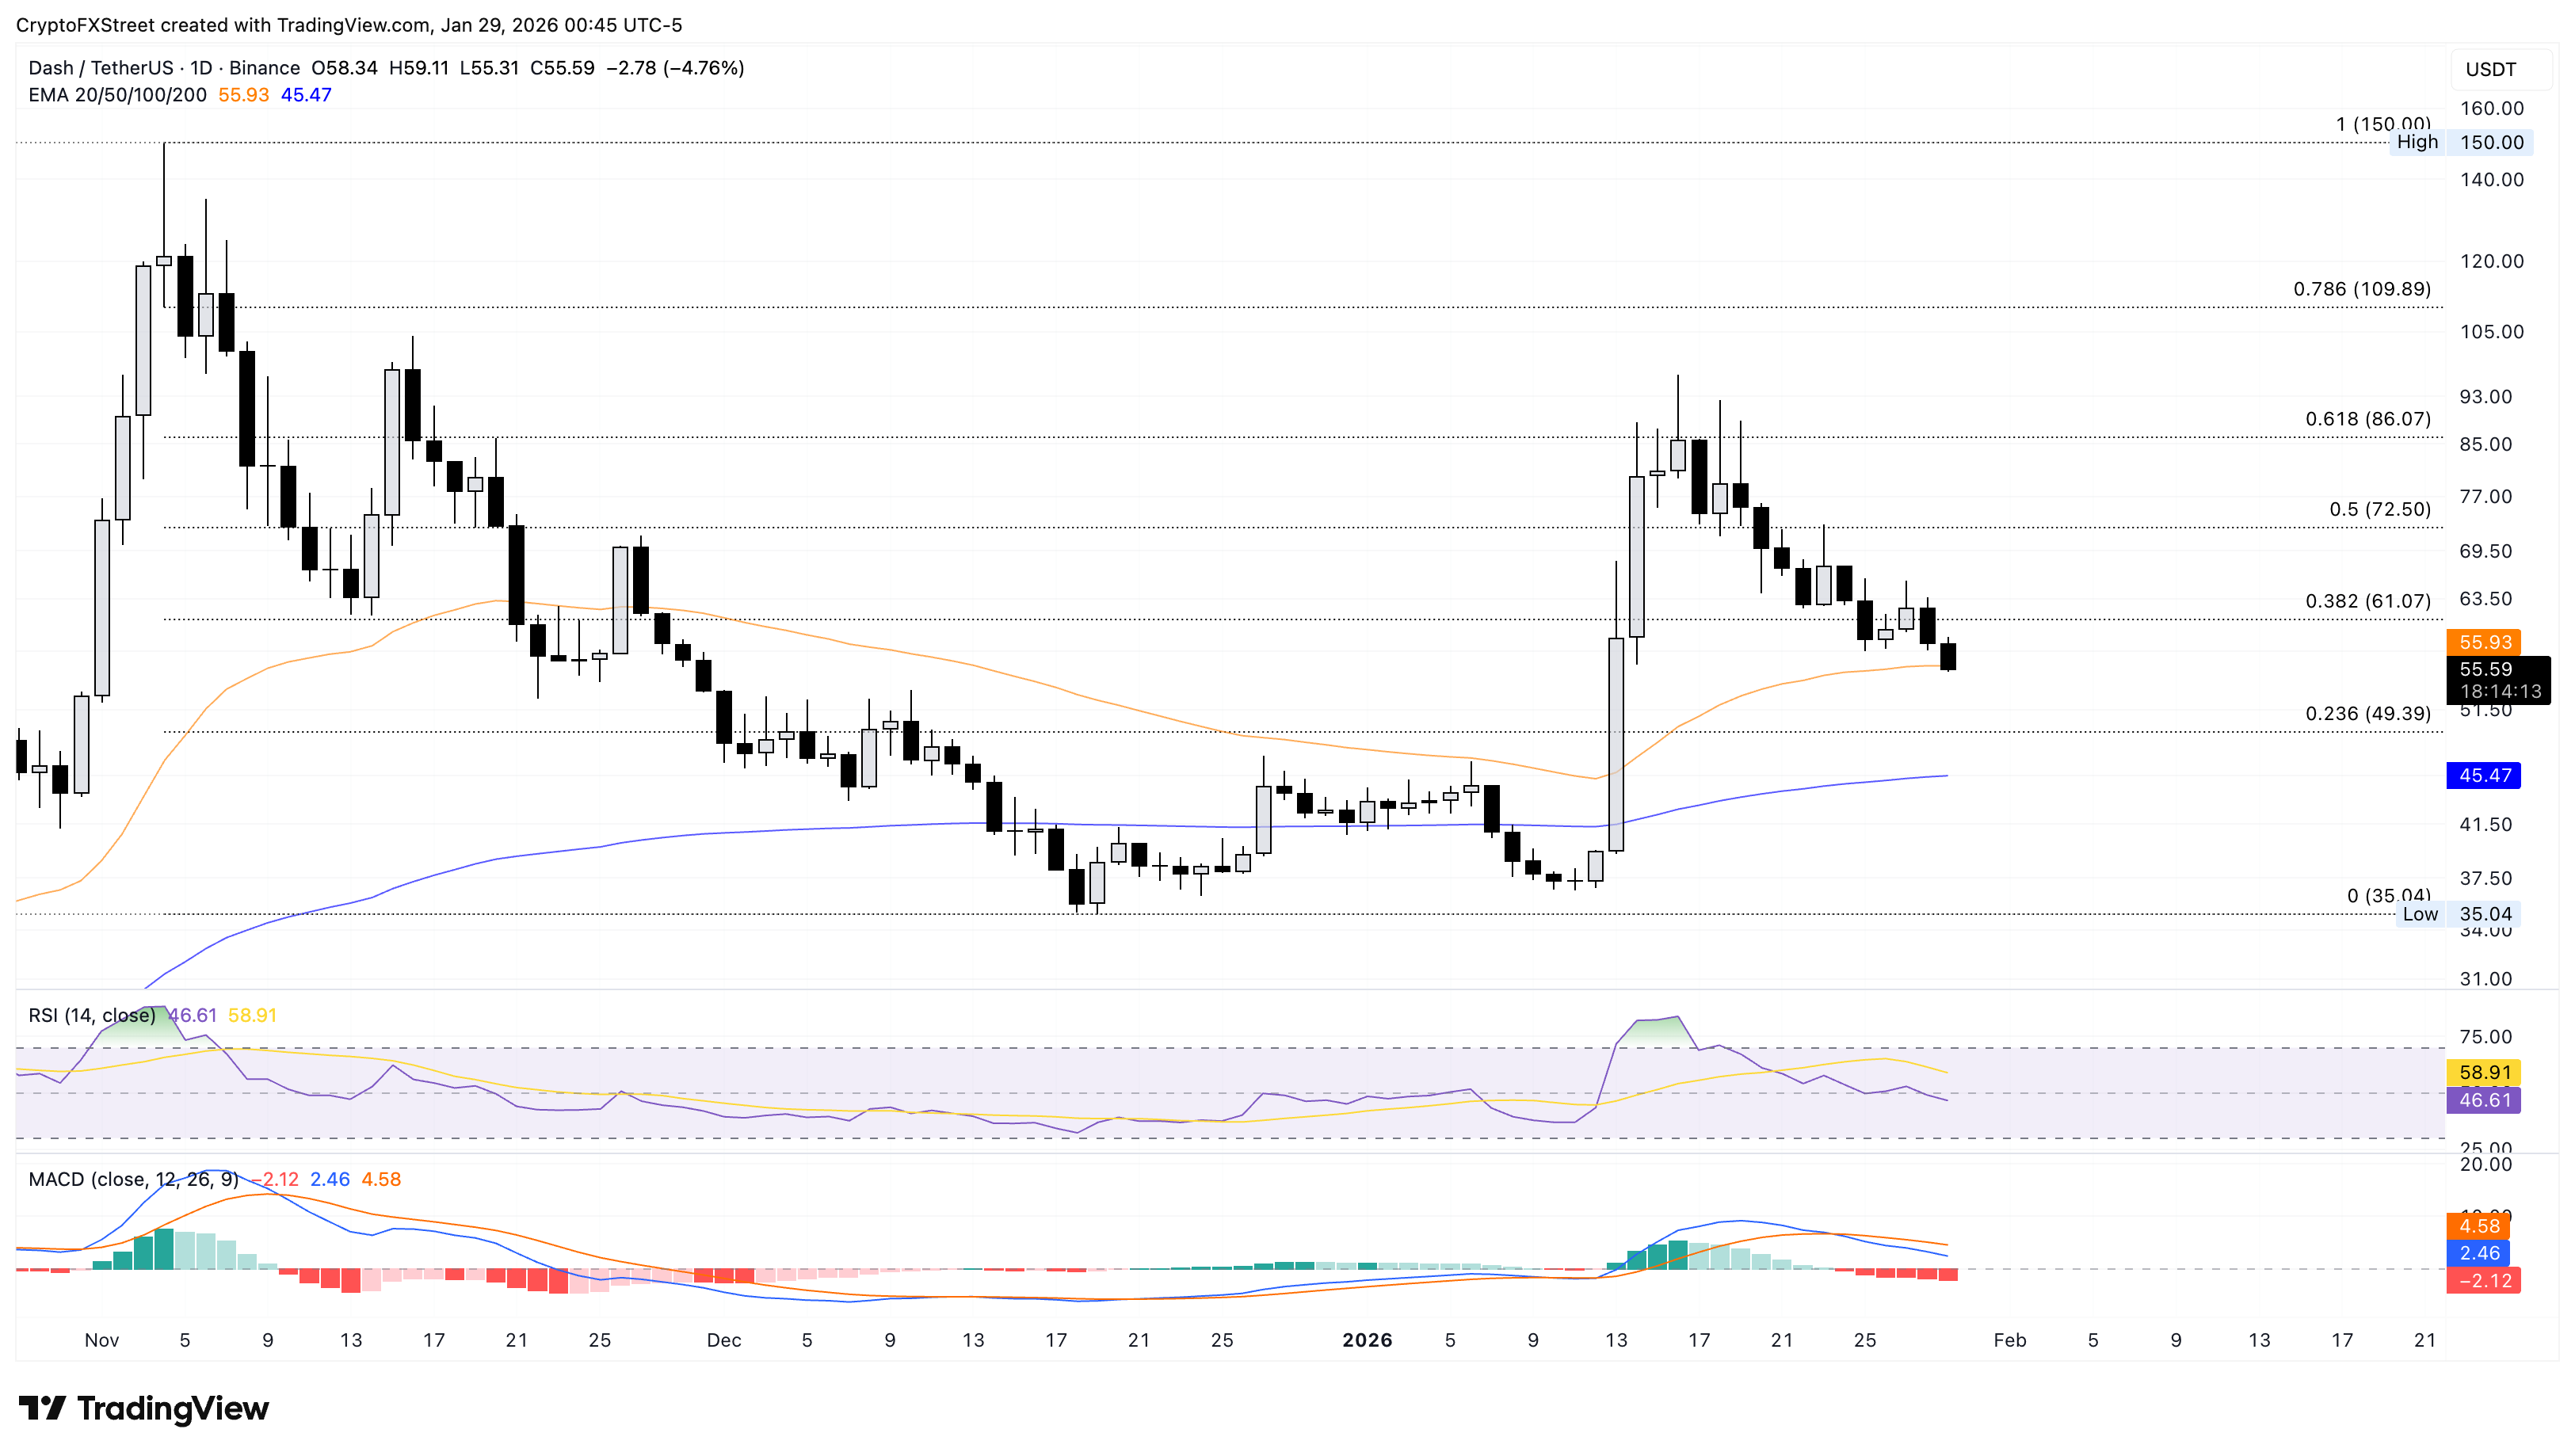
However, a potential daily close above the 50-day EMA at $55.93 would ease immediate pressure and direct the privacy coin toward the 38.2% Fibonacci retracement level at $61.07.
(The technical analysis of this story was written with the help of an AI tool.)
Author

Vishal Dixit
FXStreet
Vishal Dixit holds a B.Sc. in Chemistry from Wilson College but found his true calling in the world of crypto.




