Crypto.com Price Prediction: A trifecta of bullish signals
- Crypto.com price has produced lower daily closes throughout November.
- CRO shows bullish correlation signals between price, volume and the Relative Strength Index.
- If the market is genuinely bullish, $0.0521 should remain unbreached.

Crypto.com price shows bounce-worthy signals that merit the idea of an upcoming countertrend rise. As CRO continues trending downward, the technicals hint that the bears may be releasing their positions. Traders should keep their eye on the digital exchange token for a potentially profitable opportunity.
Crypto.com price could spike upwards soon
Crypto.com price is showing optimistic signals going into the last trading week of November. Since the initial 55% crash that happened in the middle of the month, CRO has stayed rangebound near the newfound monthly lows at $0.055 and has printed lower daily closes progressively afterward. On November 20, CRO settled the daily auctioning price at $0.0639, and on November 28, CRO price produced a stalemate at $0.0631 with a few hours left to close.
Crypto.com price currently trades at $0.0631, and if the daily close remains lower than the November 20 close at $0.0639, there will be a trifecta divergence play between the CRO price, the Volume Indicator and the Relative Strength Index (RSI).
The Volume indicator, which accounts for the total of market participants within a trading day, shows a decreased tapered pattern. Fewer market participants are involved in suppressing CRO’s auctioning price.
The Relative Strength Index, an indicator used to gauge the underlying strength and influence market participants, have over the auctioning price, produces a bullish divergence. Bullish divergence is a signal professional traders look for when trying to catch a knife.
Combining the RSI signal with the volume indicator shows that more traders are holding onto their long positions despite the declining price. If November 28 closes below $0.0639, the third divergence on the RSI and Volume Indicator should be the nail in the coffin to promote the anticipated countertrend bounce. If this is the case, key targets for a countertrend pump will be the 38.2% and 50% Fibonacci levels extracted from the 55% monthly decline. Target one would be at $0.077 and two at $0.085, up to a 35% increase from the current market value.
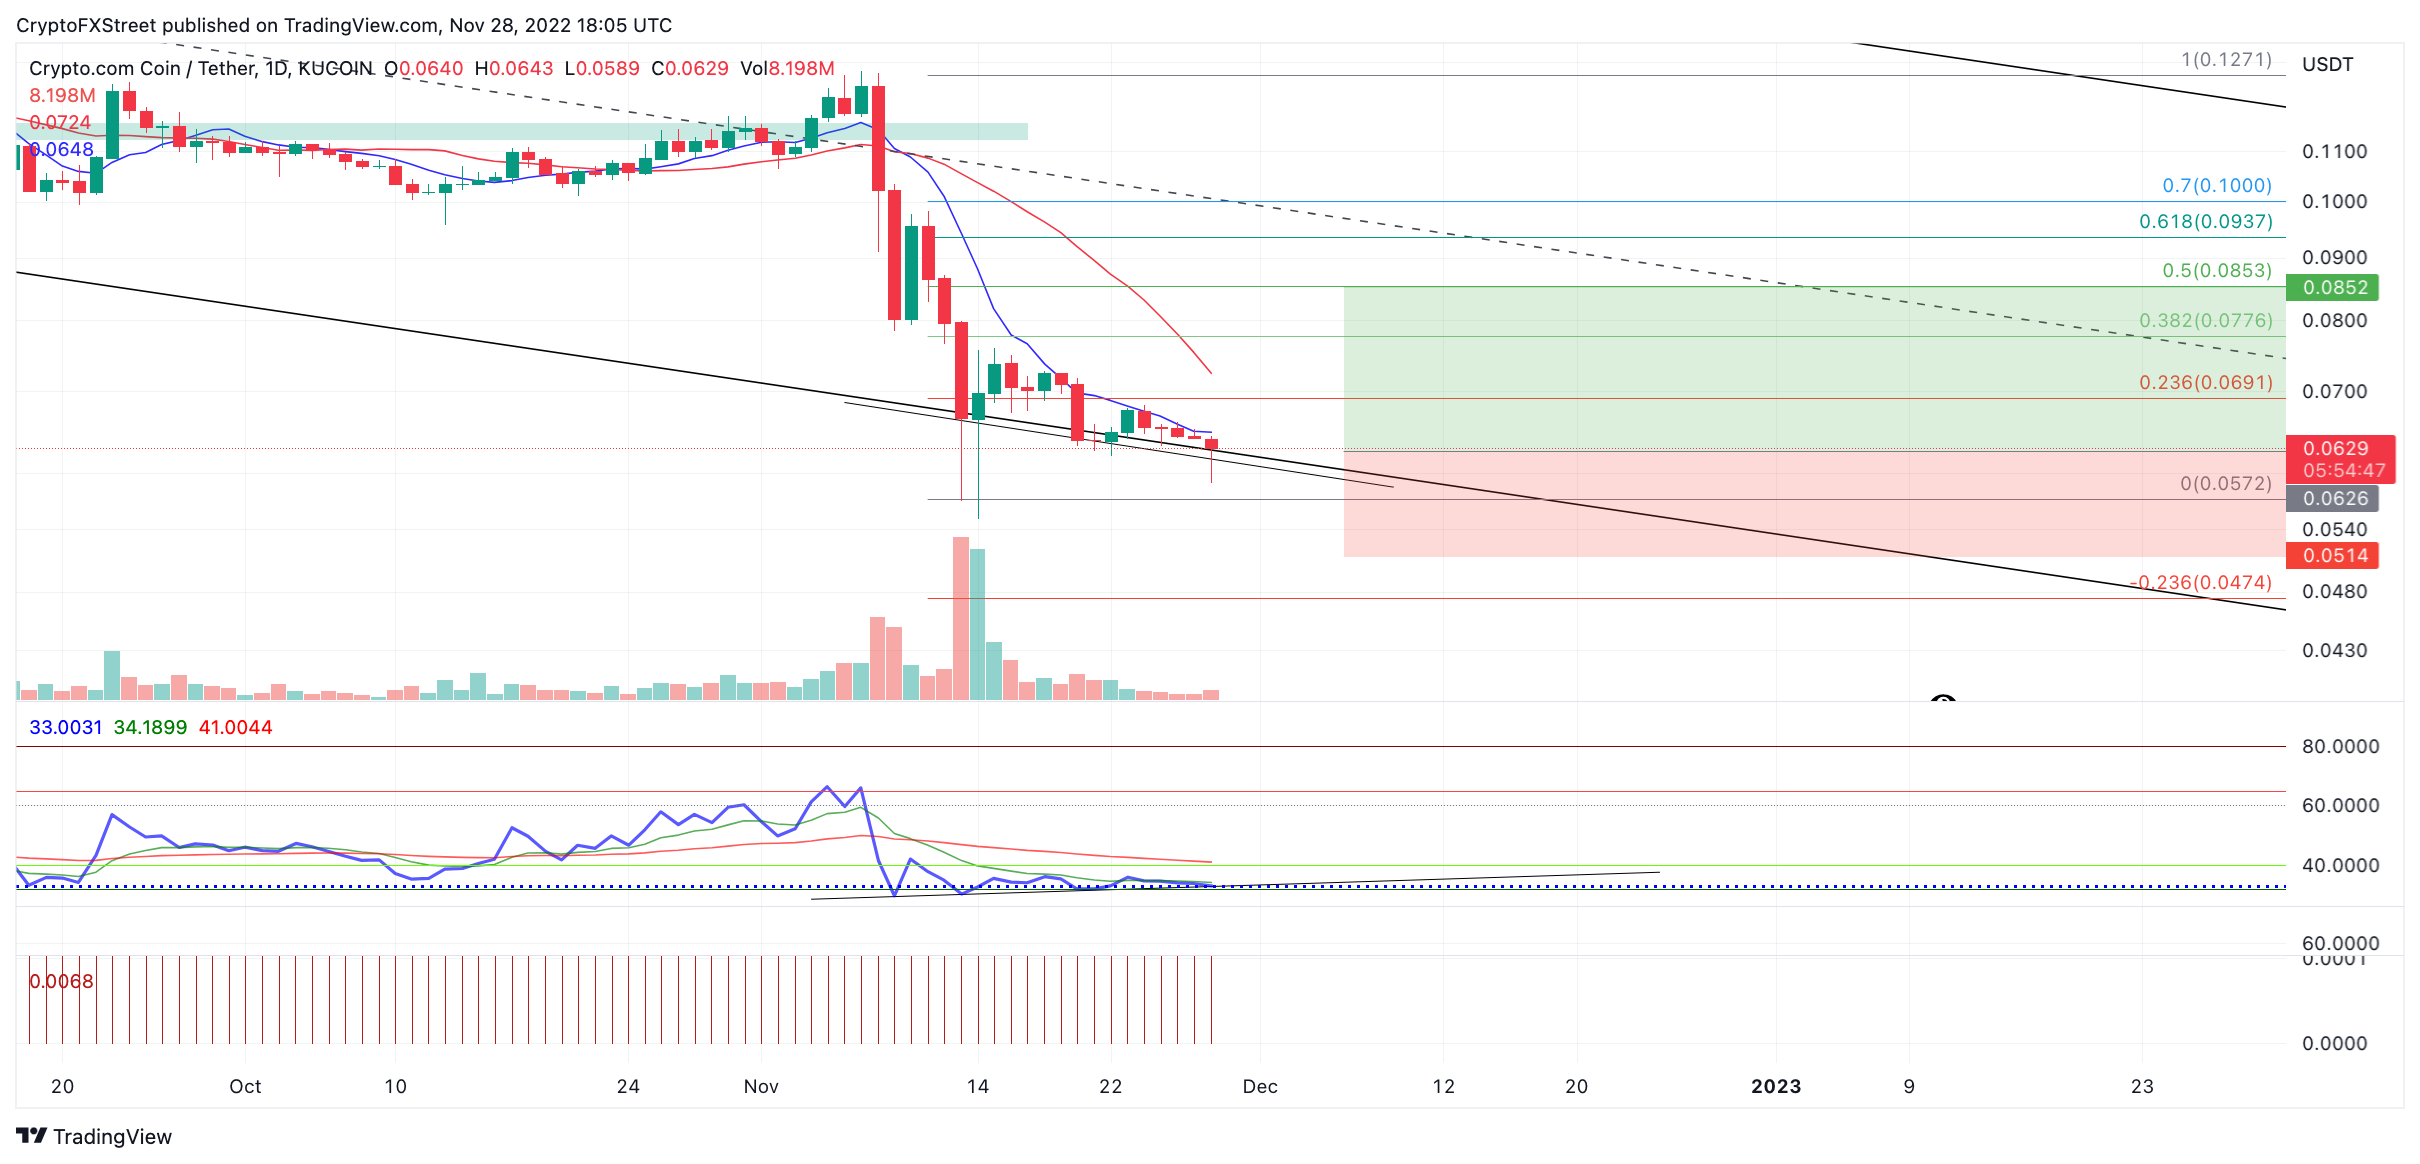
CRO/USDT 1-day chart
The ATR indicator shows the average range within a trading day. In theory, the market should only break below the average range in anticipation of strong directional moves..The ATR shows current average range value at $0.0068, which can be subtracted from the November 28 daily low at $0.0589 to equal a safety stop at $0.0521.
If the $0.0521 is broken, the market is likely to tread lower, targeting liquidity levels in the $0.04 range, which would result in a 30% decline from the current Crypto.com price.
Author

Tony M.
FXStreet Contributor
Tony Montpeirous began investing in cryptocurrencies in 2017. His trading style incorporates Elliot Wave, Auction Market Theory, Fibonacci and price action as the cornerstone of his technical analysis.


