BTC/USD: Elliott Wave and Technical Analysis

Last analysis on the 10th of July expected a continuation of downwards movement for Bitcoin. Bitcoin has moved sideways since that date.
Focus of analysis from this point onwards is on identifying a potential buying opportunity for Bitcoin.
Today's Bitcoin analysis is available to everyone.
Summary: A deep pullback is now expected to end at the 0.618 Fibonacci ratio, at 7,240.
At its end, this deep pullback may offer a good buying opportunity for Bitcoin.
At this stage, conditions are not yet oversold. The short-term volume profile favours a bearish outlook and the corrective Elliott wave structure is incomplete.
The data used for this analysis comes from Yahoo Finance BTC-USD.
All charts are on a semi-log scale.
MAIN ELLIOTT WAVE COUNT
MONTHLY
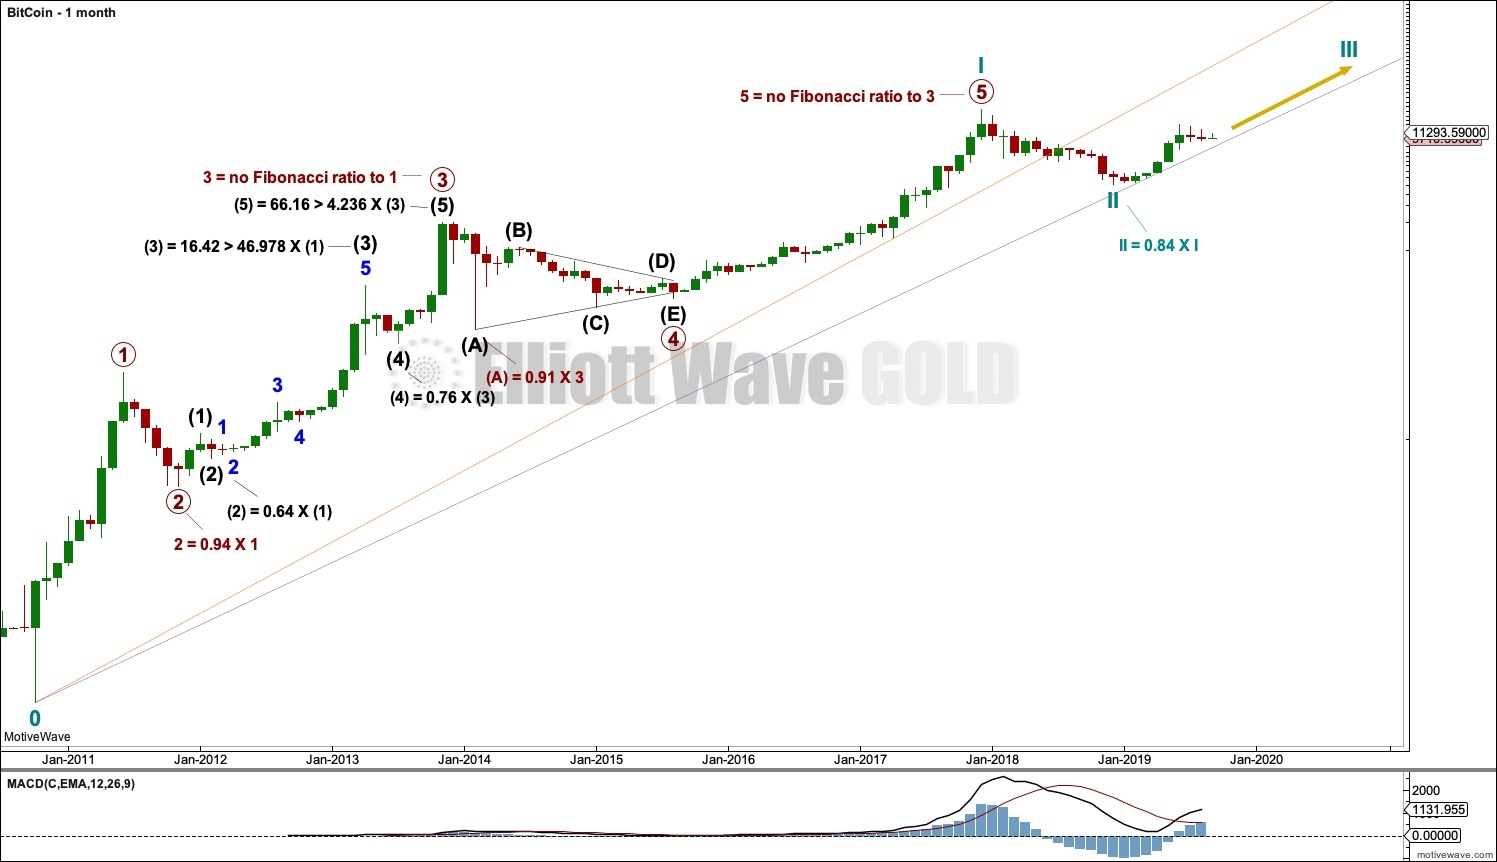
It is possible to see a completed five wave impulse upwards for Bitcoin.
I am unable to find reasonable Fibonacci ratios within this wave count. It appears that Bitcoin may not exhibit Fibonacci ratios very often between its waves, so this makes target calculation impossible. Classic technical analysis was used to identify a high in place on December 23, 2017.
What is very clear from this chart is that Bitcoin forms classic bubbles. It has done so now several times and may now be doing so again. So far each bubble has popped and Bitcoin has collapsed, to then thereafter form a new bubble. Each bubble is larger than the one prior; so if another Bitcoin bubble is forming, it may be expected to take price substantially above the all time high.
Bitcoin tends to behave like an extreme commodity: price moves upwards for about 2 – 4 weeks in a near vertical movement at the end of its rises. Following this vertical movement the resulting downwards movement is very deep (in percentage terms) and often very quick.
The next rise begins slowly with basing action over weeks or months, and then as the rise nears its end another vertical movement completes it. Also, there are volume spikes just before or at the end, which is another feature typical of commodity like behaviour.
This has happened now several times. The most notable instances are the rise up to the week ending 24th November, 2013, and the week ending 5th June, 2011. The following sharp drops were 94% and 93% respectively.
The last instance was the rise up to the last all time high for Bitcoin at 19,870.62 on the 17th of December 2017. The drop thereafter may now be considered as highly likely to be complete. If the drop is complete, it was only an 84% drop.
WEEKLY
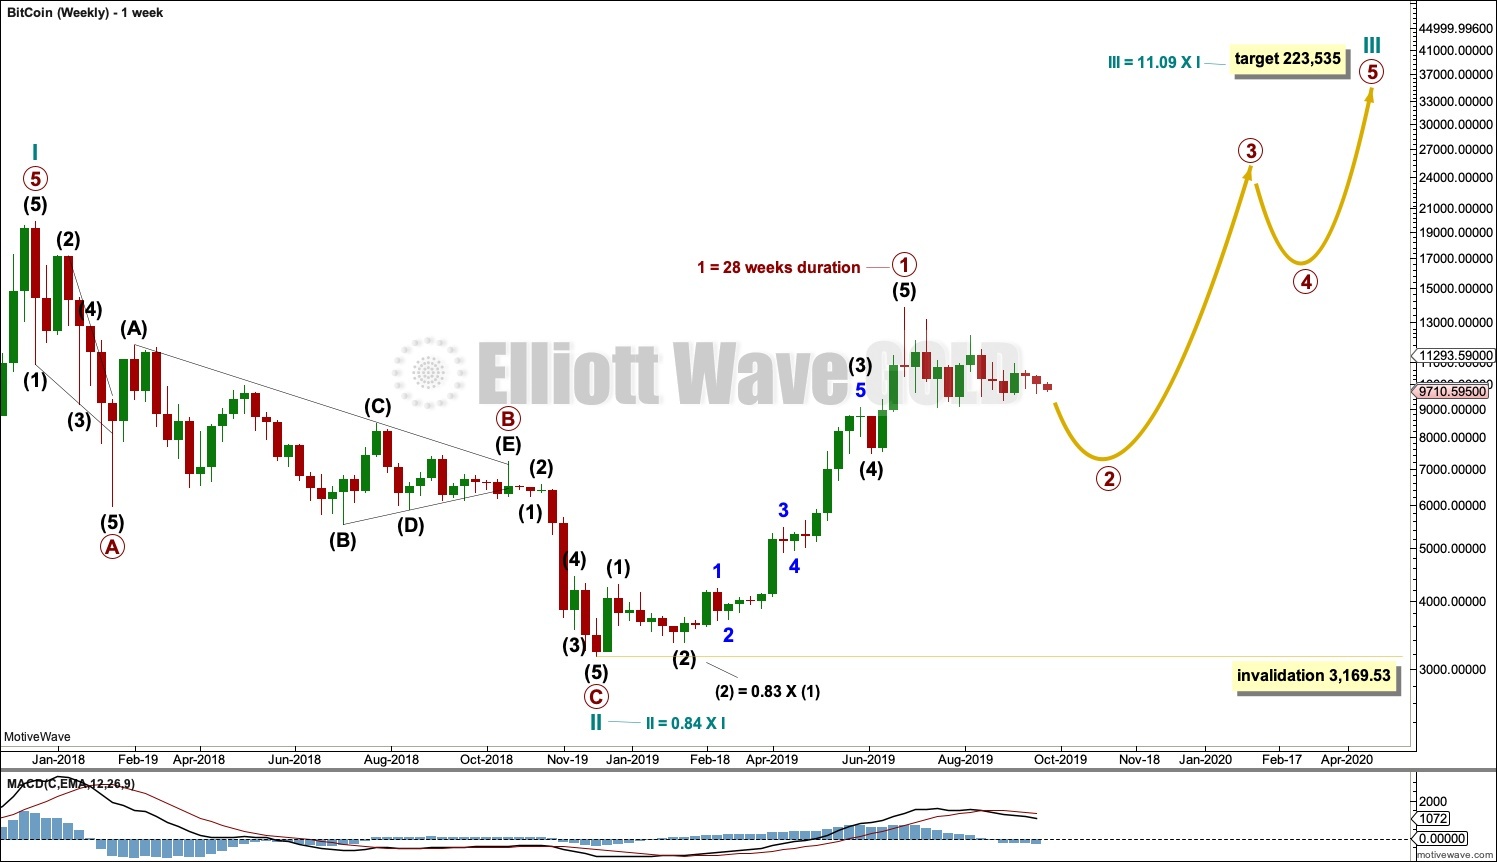
Cycle wave II may be a complete zigzag.
Cycle wave III must move above the end of cycle wave I at 19,870.62. It must move far enough above this point to allow room for cycle wave IV to unfold and remain above cycle wave I price territory.
Cycle wave I lasted 7.2 years and cycle wave II may have been over within just under one year. It would be reasonable to expect cycle wave III to last about 7 years, possibly a Fibonacci 8 or 13 years. At this stage, it may be now within its ninth month.
Cycle wave III must unfold as a simple five wave impulse, and within this impulse there should be two large corrections for primary waves 2 and 4. So far primary wave 1 may be complete. Primary wave 2 may now continue as a three wave structure downwards to possibly last about 17 weeks in duration if it is 0.618 the duration of primary wave 1. So far it has lasted 13 weeks.
The range of the depth of corrections for second waves in minor, intermediate or primary degree positions is from 0.35 to 0.94, with the average at 0.68.
Over the full price history of Bitcoin there have been two relatively shallow second wave corrections at minor degree: a combination ending 28th March 2016 was 0.35 the depth of its counterpart first wave, and a double zigzag ending September 2015 was 0.45 the depth of its counterpart first wave. All second wave corrections for Bitcoin in its price history at intermediate degree or higher were a minimum depth of 0.64 the counterpart of the first wave.
The 0.618 Fibonacci ratio would be a reasonable target for this primary degree second wave.
DAILY
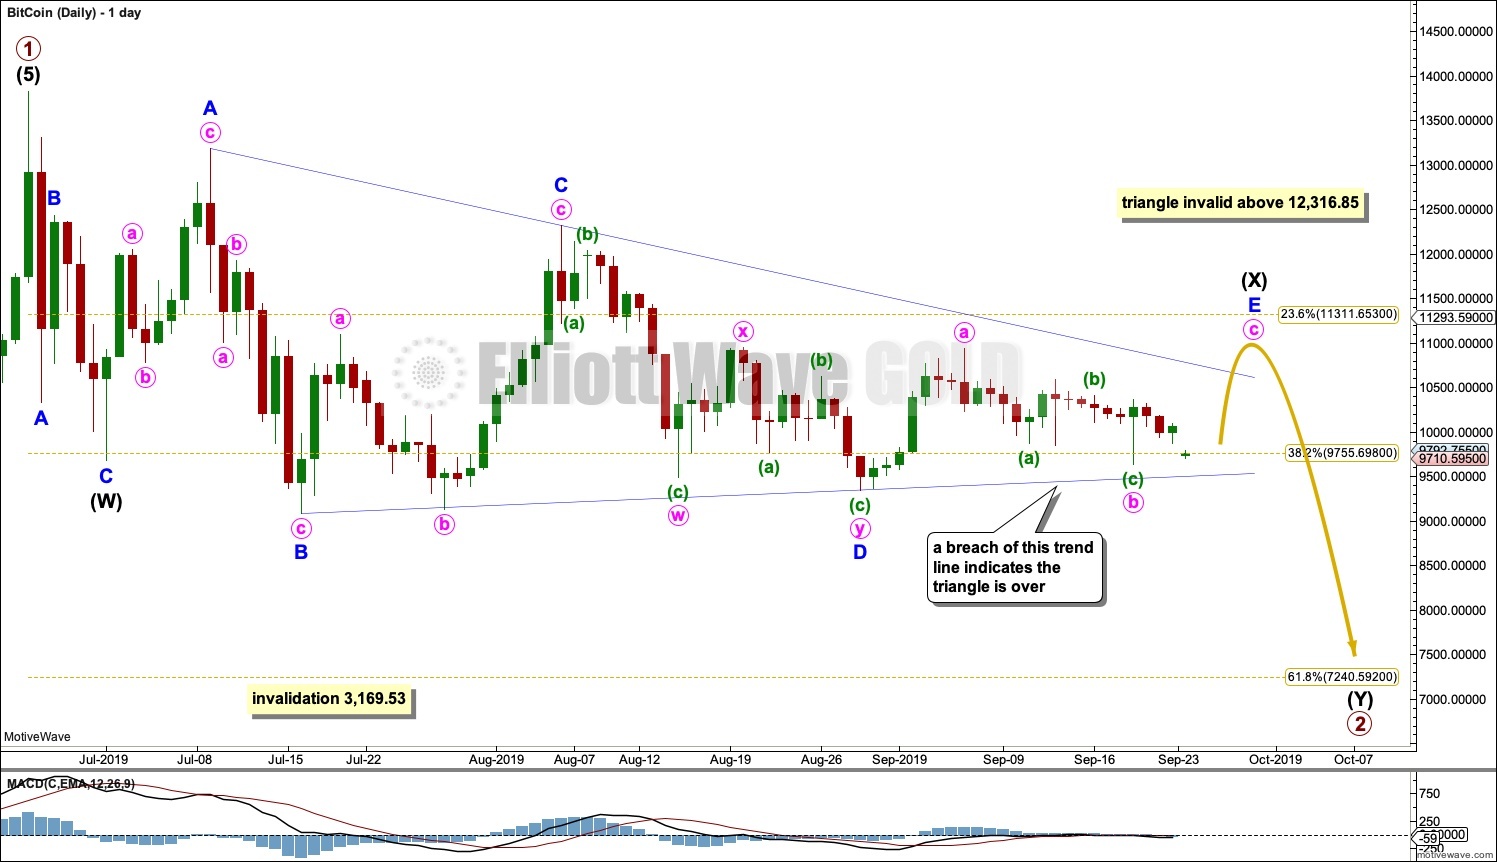
In the price history of Bitcoin to date second waves of all degrees subdivide (in order of frequency) as zigzags (10), double zigzags (7), flats (3) and combinations (only 1 example).
At this stage, a zigzag may be eliminated for primary wave 2. The first wave down labelled intermediate wave (W) subdivides as a three and not a five.
Also at this stage, a flat may also be eliminated for primary wave 2. The bounce labelled intermediate wave (X) has failed to retrace the minimum requirement of 0.9 the length of intermediate wave (W).
A double zigzag is the second most common structure for a second wave, so this is what it may be unfolding as. The second zigzag in the double labelled intermediate wave (Y) may bring price down close to the 0.618 Fibonacci ratio.
At this stage, the degree of labelling within primary wave 2 looks right and shall now be left as is with some confidence.
Sideways movement of the last few weeks now looks like a triangle may be completing, which may be a running contracting triangle that is labelled intermediate wave (X). The lower B-D trend line should offer strong support while the triangle is incomplete. Minor wave E may end with an overshoot of the upper A-C trend line.
A downwards breakout to new lows would be expected for intermediate wave (Y) when the triangle is complete.
In terms of duration expected for primary wave 2, the price history of Bitcoin shows that second waves at primary or cycle degree were 0.67 and 0.14 the duration of their counterpart first waves. Here, primary wave 1 lasted 192 sessions and primary wave 2 may last 0.618 (119 sessions). So far it has lasted 89 sessions.
DAILY – SUPPORT
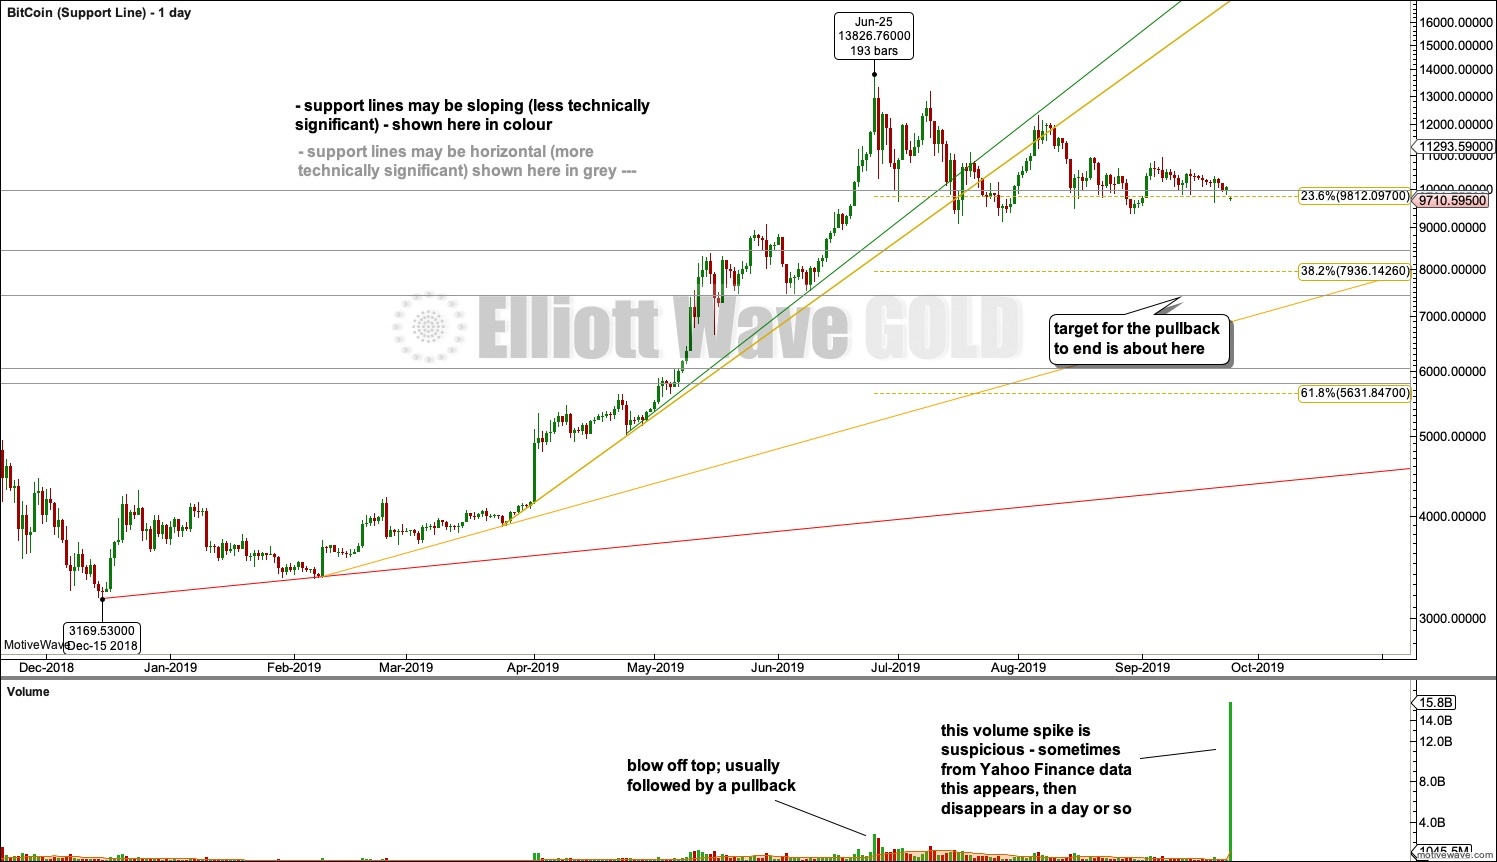
This daily chart is on a semi-log scale. This is the correct scale to view sloping support and resistance.
In Bitcoin's price history both prior second waves at primary and cycle degree have breached a support line, which contained the first wave of the same degree. This is normal and to be expected.
Four potential support lines for the current primary wave 1 are drawn. The lowest in red looks unlikely to be breached by the current pullback. The highest in green and yellow have been breached.
TECHNICAL ANALYSIS
WEEKLY
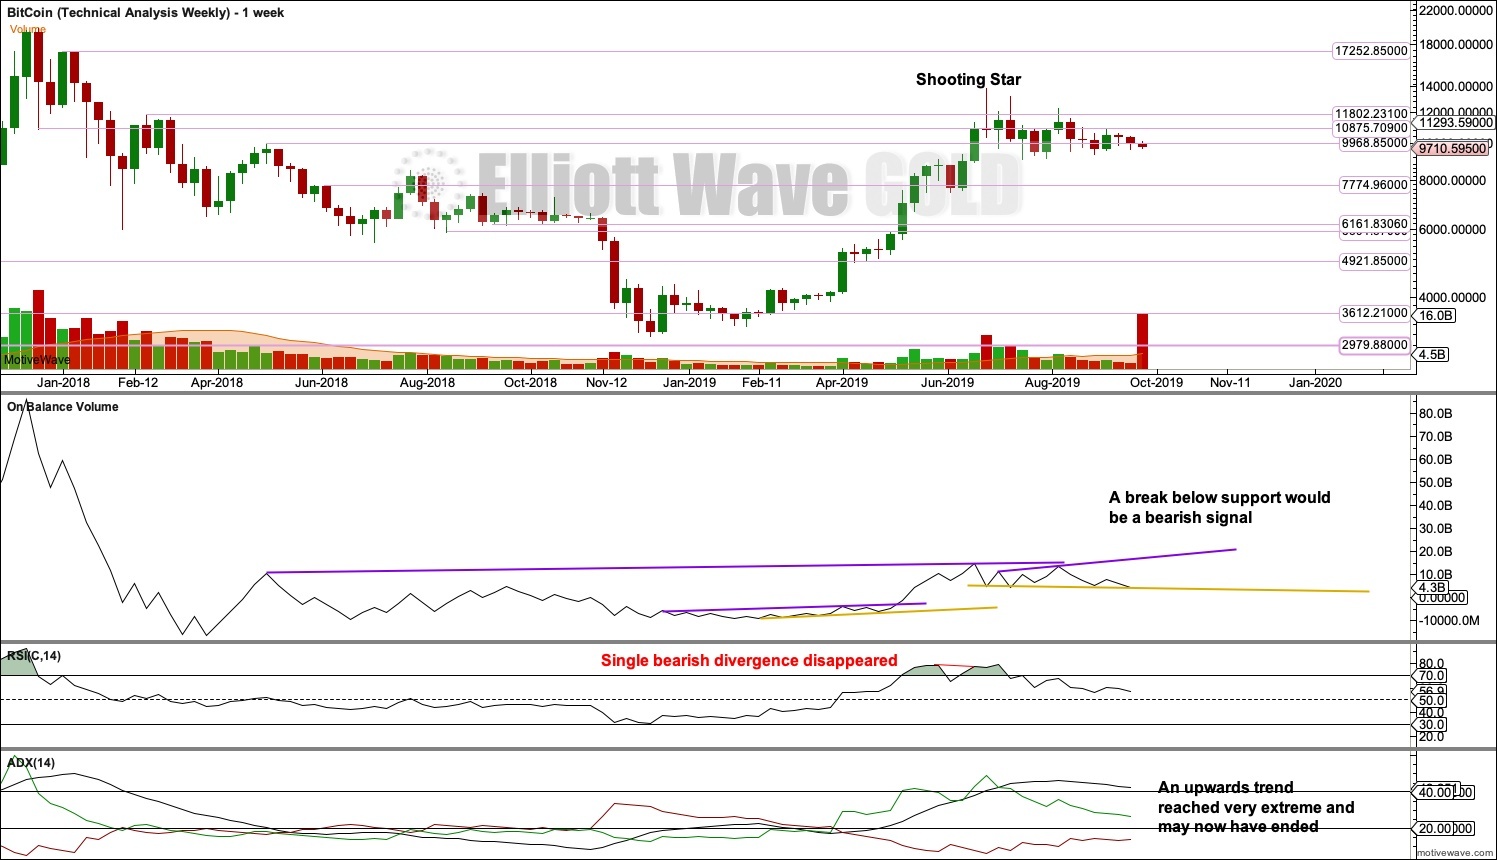
The following characteristics can be noted at the end of prior major highs for Bitcoin:
The first sharp rise to the week beginning 5th June 2011: near vertical movement for several weeks, a sharp volume spike for a blow off top on the final week, and no candlestick reversal pattern on the weekly chart but an Evening Doji Star on the daily chart. The following correction was 0.94.
The next sharp rise to the week beginning 7th April 2013: near vertical movement for three weeks, a sharp volume spike on the final week that closed red and formed a Bearish Engulfing pattern on the weekly chart, a Bearish Engulfing pattern on the daily chart, ADX remained very extreme for most of the rise, and single week bearish divergence between price and RSI at the end. The following correction was 0.82.
The next sharp rise to the week beginning 24th November 2013: vertical movement for four weeks, a strong rise in volume until the last week (which saw volume fall), a Bearish Engulfing pattern on the weekly chart, an Evening Doji Star on the daily chart (the third candlestick of which had strong support from volume), ADX reached very extreme for many days, and RSI reached extreme overbought and there exhibited single bearish divergence. The following correction was 0.93.
The last sharp rise to the all time high at 19,870.62 on the 17th of December 2018: vertical movement for three weeks, a strong increase in volume up to the last week (which saw a fall in volume), a Bearish Engulfing pattern on the weekly chart that had support from volume; on the daily chart, ADX reached very extreme for a coupe of weeks or so, RSI reached overbought and there exhibited single bearish divergence, and early downwards movement from the high had support from volume. The following correction was 0.84.
Some conclusions may be drawn about how to identify a major high in Bitcoin:
– Look for vertical movement on the weekly chart for at least two weeks, and possibly up to several (although when it is more than three the movement may be interspaced with a small pause).
– Look for either a sharp volume spike for a blow off top, or a strong increase in volume then followed by a single week of lighter volume at the possible high.
– A bearish candlestick reversal pattern has been seen so far at every major high for Bitcoin, so an absence of any candlestick reversal pattern at a potential high should be viewed very suspiciously.
– ADX is of no use as it may remain very extreme for long periods of time.
– RSI may also remain very extreme for long periods of time and may not exhibit any divergence, but it may add a little confidence in the high if it does exhibit bearish divergence in conjunction with other indicators being bearish.
The last vertical rise now exhibits enough of the points looked for to have some confidence that Bitcoin may have found an interim top: vertical movement for three weeks, a volume spike on the last week, and a very bearish long upper wick on the candlestick at the high, although this is not a candlestick reversal pattern.
DAILY
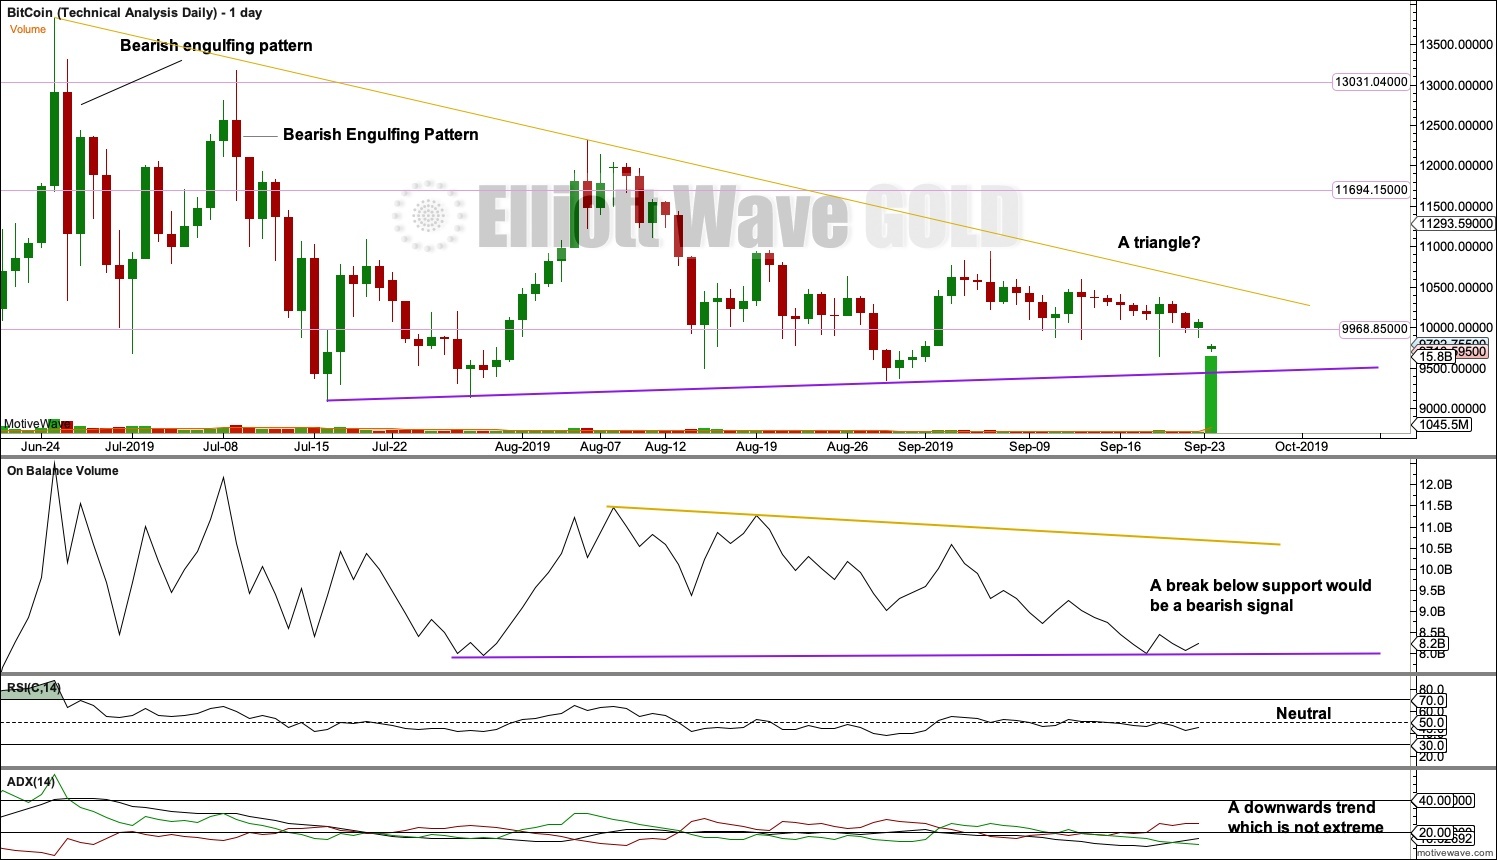
Support levels are noted as possible lows for the next expected deep pullback.
The following can be noted when looking back at Bitcoin's behaviour during its previous strong falls in price:
The 94% fall in price from June to November 2011 was characterised by:
– Three clearly separate instances of RSI reaching oversold on the daily chart, separated by bounces.
– ADX did not remain very extreme for very long at all on the daily chart.
– On Balance Volume exhibited weak single bullish divergence at the low. The 93% fall in price from November 2013 to February 2014 was characterised by:
– RSI reached oversold and remained deeply oversold for three weeks; at the low, there was only single weak bullish divergence with price.
– ADX remained very extreme for the last seven sessions to the low.
– At the low, On Balance Volume did not exhibit bullish divergence with price. It remained bearish and then exhibited further bearishness after the low as it continued to decline as price began to rise.
The 84% fall in price from December 2017 to December 2018 was characterised by:
– RSI reached deeply oversold and then exhibited double divergence with price.
– ADX reached very extreme 20 sessions prior to the low.
– At the low, On Balance Volume exhibits no bullish divergence with price; it turned with price.
Currently, RSI has not yet reached oversold and ADX does not indicate a trend change. If the Elliott wave count is correct, then the current pullback has a long way to go.
Currently, a triangle may be completing. While Elliott wave triangles are always continuation patterns, classic triangles may be either continuation or reversal patterns. Support is noted in purple. Resistance is noted in gold. Watch for a breakout and then a backtest.
Author

Lara Iriarte, CMT
Elliott Wave Gold
Lara Iriarte is a Chartered Market Technician and a Registered Financial Advisor in New Zealand.


