Bitcoin Price Top Forecast: Breaking above downtrend resistance is the next step
- The BTC/USD had a roller coaster week and ended on top.
- A collection of developments was mostly positive for cryptocurrencies.
- The technical picture is improving but Bitcoin needs to break above downtrend resistance. The experts' poll shows a bearish tendency in the medium and long-term.

The price of Bitcoin had a bad start to the week, but things quickly improved. Bitcoin Cash, that forked out of the primary digital coin back in 2017, enjoyed a boost from the Bitmain IPO in Hong Kong. The successful listing of the firm that holds BCH sent all coins higher.
JP Morgan, one of the largest banks, is moving deeper into the blockchain technology. The Quorom is based on Ethereum, but Bitcoin also gained. Is the period of consolidation over? Many crypto doubters are now finding investment in cryptos attractive.
In order to attract mainstream investors, an Exchange Traded Fund will be needed. The SEC is not rushing to take a decision anytime soon, but when it does happen, the moves could be massive. To understand more about ETF's see: Bitcoin ETF explained: 9 questions and answers about the critical crypto catalyst
Another positive development came from Google. The tech giant that previously announced a ban on crypto advertisements, is now taking baby steps to allow such ads in the US and Japan. Contenders will undergo a lengthy process, but this may be the first step to broader acceptance.
Get 24/7 Crypto updates in our social media channels: Give us a follow at @FXSCrypto and our FXStreet Crypto Trading Telegram channel
BTC/USD Technical Analysis - Downtrend resistance is critical
-636737392269297759.png)
The BTC/USD is currently trading above the 50-day Simple Moving Average, a positive sign, but we were here before, not that long ago. The $6,800 level is key. The level capped the pair earlier in September and is also where the downtrend resistance line from July meets the price at the time of writing. Breaking higher is crucial for further upside moves.
Momentum has turned positive for Bitcoin but the Relative Strength Index is not going anywhere fast. The 200-day SMA is around the $7,400 level which is a high resistance line.
In between $6,800 and $7,400 we find the round number of $7,000. Just above, $7,150 capped the BTC/USD in late August and $7,200 provided support when it traded on high ground.
$6,600 was a line of resistance in mid-September and serves as a support. Further down, $6,300 was a swing low earlier in the week. $6,200 provided support in mid-August and $6,050 was the flash crash low from earlier in the month.
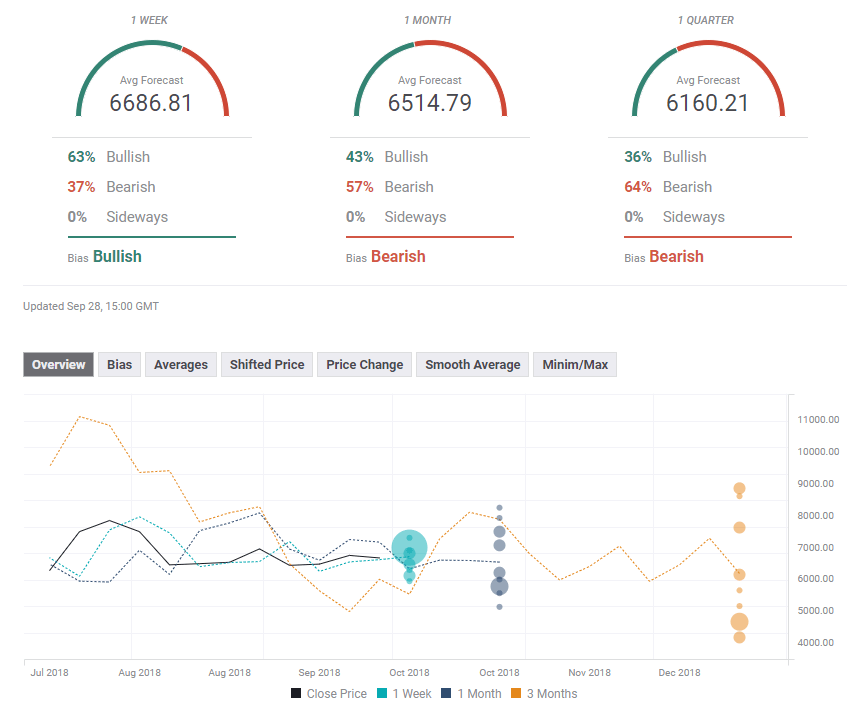
The Forecast Poll of experts shows a bullish bias in the near-term but a bearish one in the medium and long-term, with falling targets. The forecasts for the near and medium terms have not changed, but long-term forecasts have dropped sharply.
Author

Yohay Elam
FXStreet
Yohay is in Forex since 2008 when he founded Forex Crunch, a blog crafted in his free time that turned into a fully-fledged currency website later sold to Finixio.


