Bitcoin, Ethereum, and XRP break below critical support levels, suggesting massive correction underway
- Bitcoin is still slightly bearish despite the fall from levels above $19,000; downside eyes $17,500.
- Ethereum falls significantly after breaking the ascending triangle support; declines target $500.
- Ripple could continue with the bearish leg to $0.44 (200 SMA), mostly if the price closes the day under $0.56.

The cryptocurrency market is experiencing the return of bears this week. For over two weeks, Bitcoin, Ethereum, and Ripple held in extreme danger zones. With the three largest cryptocurrencies trading under crucial support levels, extended declines could dominate the market in the coming days.
Bitcoin on the brink of freefall to $17,500
The flagship cryptocurrency is trading at $18,260 after a minor rebound from the support at $18,000. Instability came knocking in the crypto market after BTC failed to overcome the resistance at $19,500 multiple times in the last 14 days.
At the moment, BTC is dancing under the 50 Simple Moving Average and the 100 SMA, which adds credibility to the downtrend. The Relative Strength Index reinforces the bearish outlook, with the dip in the oversold region.
BTC is likely to explore the downside some-more, mostly if it closes the day under $18,200. The bearish leg might extend to the 200 SMA at $17,500 before a significant recovery comes into the picture.
-637430801822547172.png)
BTC/USD 4-hour chart
Ethereum downside eyes $500
The smart contract token continued with the bearish leg after breaking the ascending triangle hypotenuse support. Selling orders increased as bears became overly hopeful that Ethereum will hit lows under $500.
Meanwhile, Ether is trading at $548 after dropping under the 100 SMA support ($575). The final leap to $500 will be validated if Ether closes the day under $560. Minor buyer congestion at $540 and the 200 SMA slightly under $525 might absorb some of the selling pressure.
%20-%202020-12-09T054205.632-637430801875519930.png)
ETH/USD 4-hour chart
The RSI has confirmed the bearish narrative after diving into the oversold region. For now, the path of least resistance is downwards until Ether establishes formidable support where buyers can rebuild the hope for a rebound.
Ripple starts the anticipated dump as sellers get hopeful
Ripple confirmed the bearish scenario explored earlier this week by closing the day under two key levels; the 100 SMA and the triangle’s lower trendline. Overhead pressure on the cross-border token has increased in the last 24 hours.
XRP is trading at $0.55 after dropping from highs above $0.61, traded on Monday. The declines are likely to continue if XRP closes the day under $0.56. Support is expected at the 200 SMA ($0.44), but the symmetrical triangle has eyes on $0.32.
%20(24)-637430801925523369.png)
XRP/USD 4-hour chart
Bitcoin, Ethereum, and Ripple seem undervalued
The market value related value (MVRV), an on-chain tool by Santiment, shows that Bitcoin and Ethereum have started to erase the investors’ profits. When used in conjunction with the danger zone divergence model, the metric suggests that ETH and BTC have left the danger zone and are only slightly bearish.
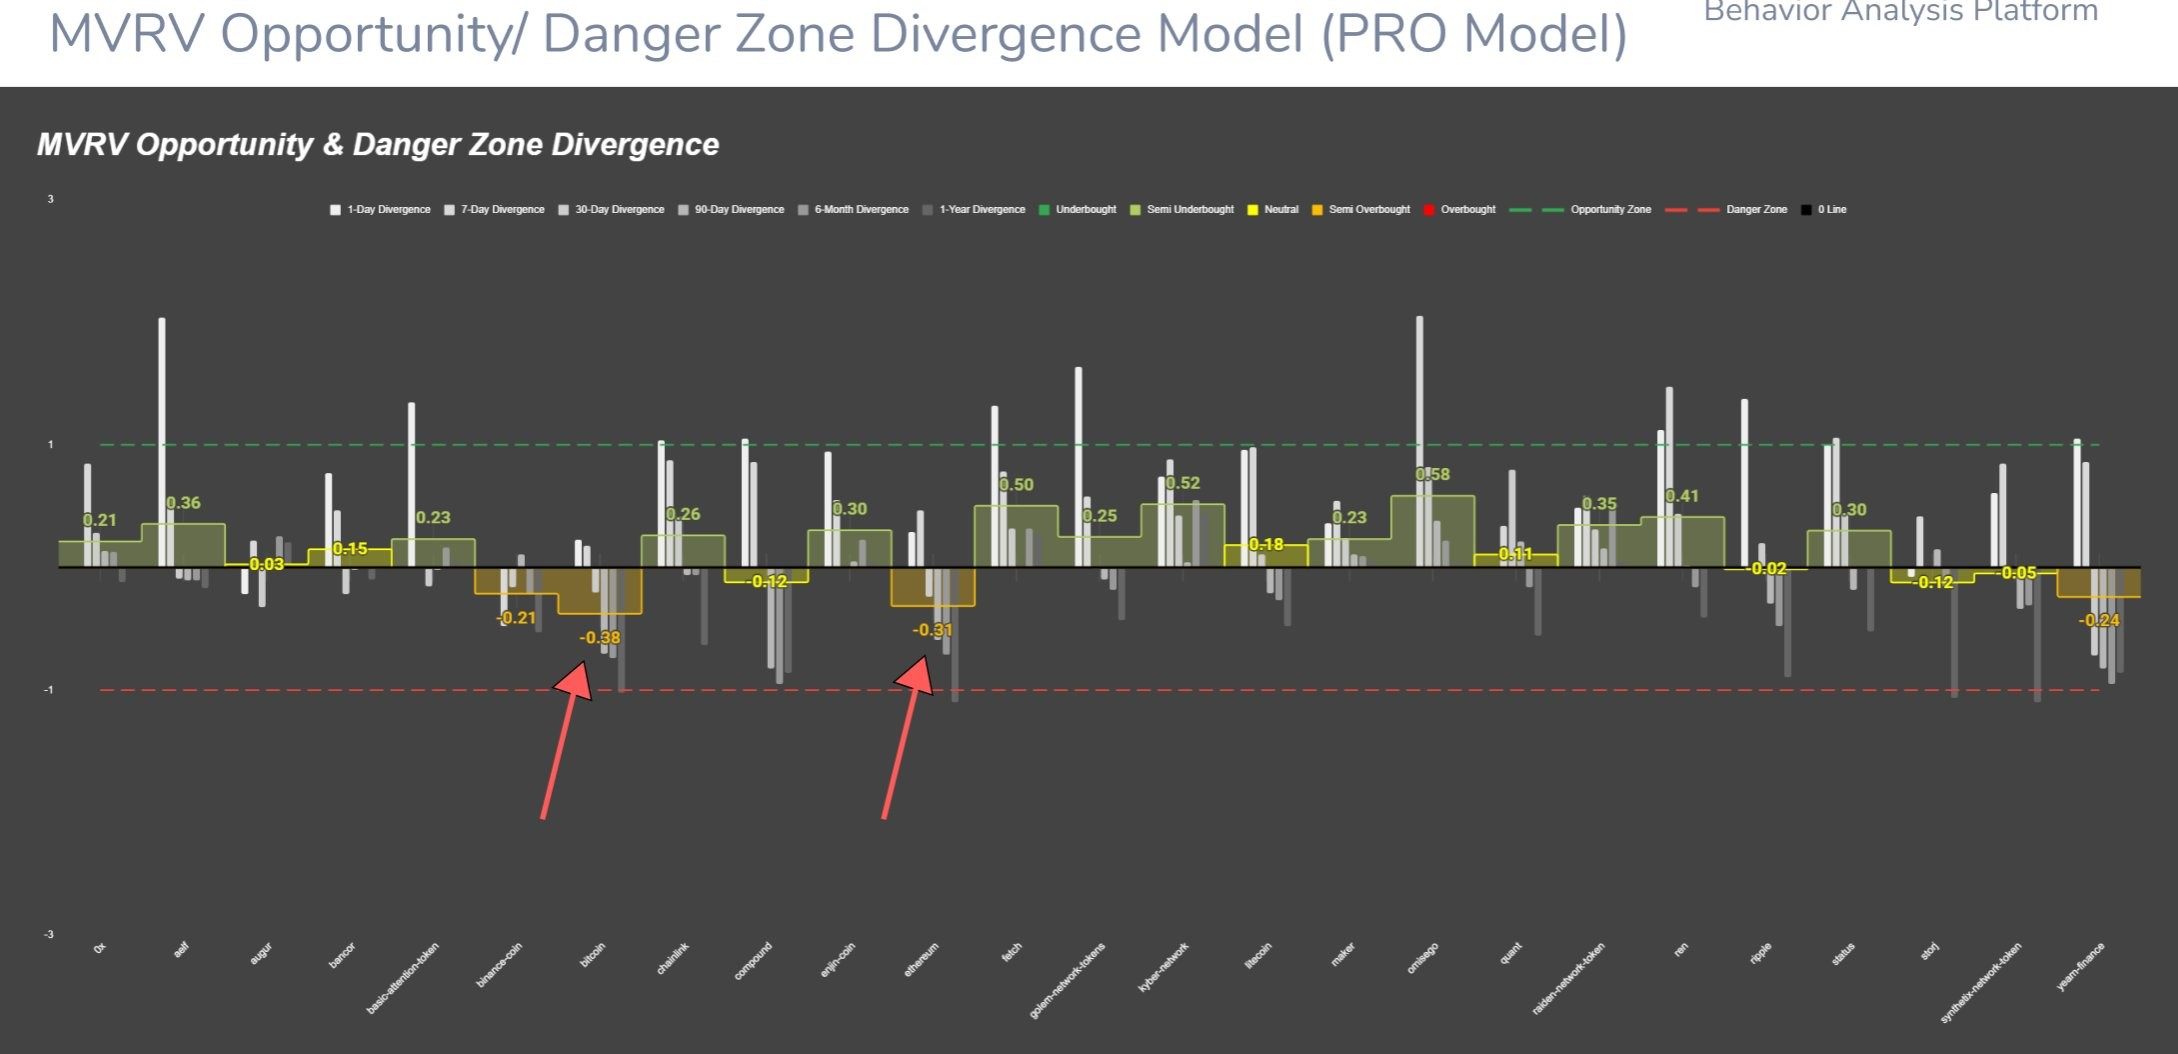
Bitcoin/Ethereum MVRV vs. danger zone divergence model
However, altcoins display an improving bullish divergence as per the average trader return success. The model can be used to gauge the risk associated with longs on different trading assets.
Author

John Isige
FXStreet
John Isige is a seasoned cryptocurrency journalist and markets analyst committed to delivering high-quality, actionable insights tailored to traders, investors, and crypto enthusiasts. He enjoys deep dives into emerging Web3 tren


