Bitcoin Elliott Wave technical analysis [Video]
![Bitcoin Elliott Wave technical analysis [Video]](https://editorial.fxstreet.com/images/Markets/Currencies/Digital Currencies/Bitcoin/bitcoins-52602600_XtraLarge.jpg)
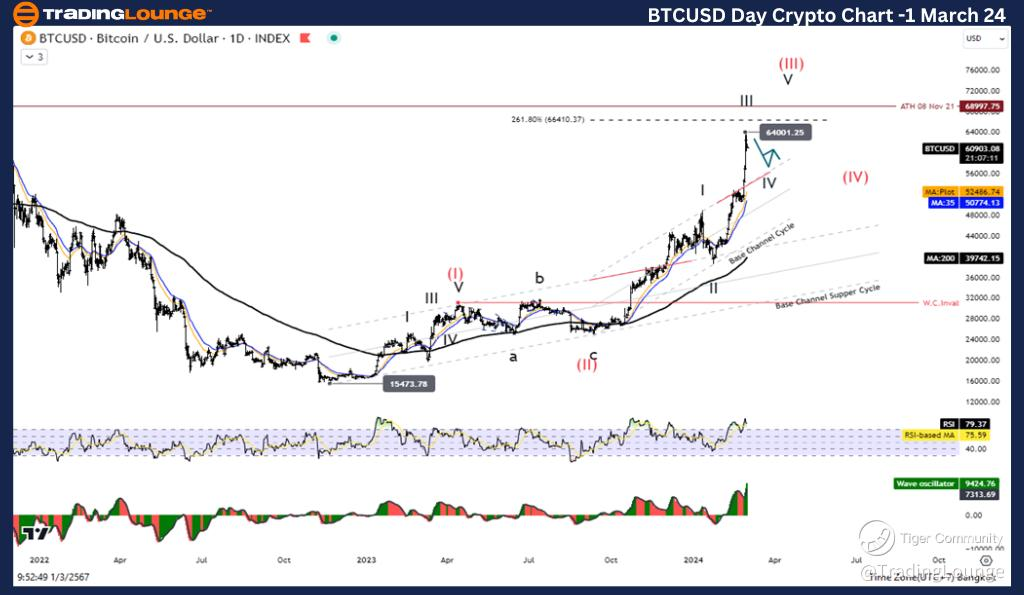
Elliott Wave Analysis TradingLounge Daily Chart, 1 March 24,
Bitcoin/ U.S. dollar(BTCUSD).
BTC/USD Elliott Wave technical analysis
Function: Follow Trend.
Mode: Motive.
Structure: Impulse.
Position: Wave III.
Direction Next higher Degrees: Wave (III).
Wave Cancel invalid level: 31046.25.
Bitcoin/ U.S. dollar(BTCUSD)Trading Strategy:
Wave action (III) in the form of an often extended impulse. It is likely to go up to test the 66410.307 level. In the short term, there may be a correction in Wave IV before rising again. Therefore, Bitcoin overall is still in an uptrend.
Bitcoin/U.S. dollar(BTCUSD)Technical Indicators: The price is above the MA200 indicating an Uptrend, Wave Oscillators a bullish Momentum.
TradingLounge Analyst: Kittiampon Somboonsod, CEWA
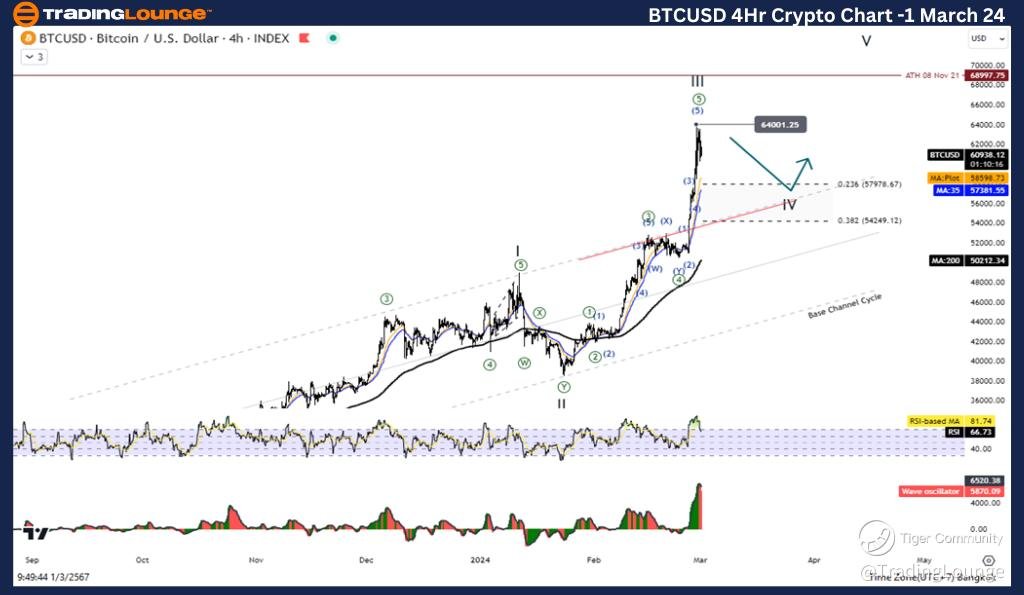
Elliott Wave Analysis TradingLounge 4Hr Chart, 1 March 24,
Bitcoin/U.S. dollar(BTCUSD).
BTC/USD Elliott Wave technical analysis
Function: Follow Trend.
Mode: Motive.
Structure: Impulse.
Position: Wave III.
Direction Next higher Degrees: Wave (III).
Wave Cancel invalid level: 31046.25.
Bitcoin/ U.S. dollar(BTCUSD)Trading Strategy:
Wave action (III) in the form of an often extended impulse. It is likely to go up to test the 66410.307 level. In the short term, there may be a correction in Wave IV before rising again. Therefore, Bitcoin overall is still in an uptrend.
Bitcoin/U.S. dollar(BTCUSD)Technical Indicators: The price is above the MA200 indicating an Uptrend, Wave Oscillators a bullish Momentum.
Author

Peter Mathers
TradingLounge
Peter Mathers started actively trading in 1982. He began his career at Hoei and Shoin, a Japanese futures trading company.


