Bitcoin Detailed Analysis and Trade Setup (Elliott Wave) 15th October 2018 onwards [Video]
![Bitcoin Detailed Analysis and Trade Setup (Elliott Wave) 15th October 2018 onwards [Video]](https://editorial.fxstreet.com/images/Markets/Currencies/Digital Currencies/Bitcoin/bitcoin_closer_XtraLarge.jpg)
For a detailed outlook and trading strategy check the below video report.
As per the daily chart of Bitcoin (BTC/USD) below,it seems that BTC has completed a Triangle formation (As per Elliott Wave Terminology).
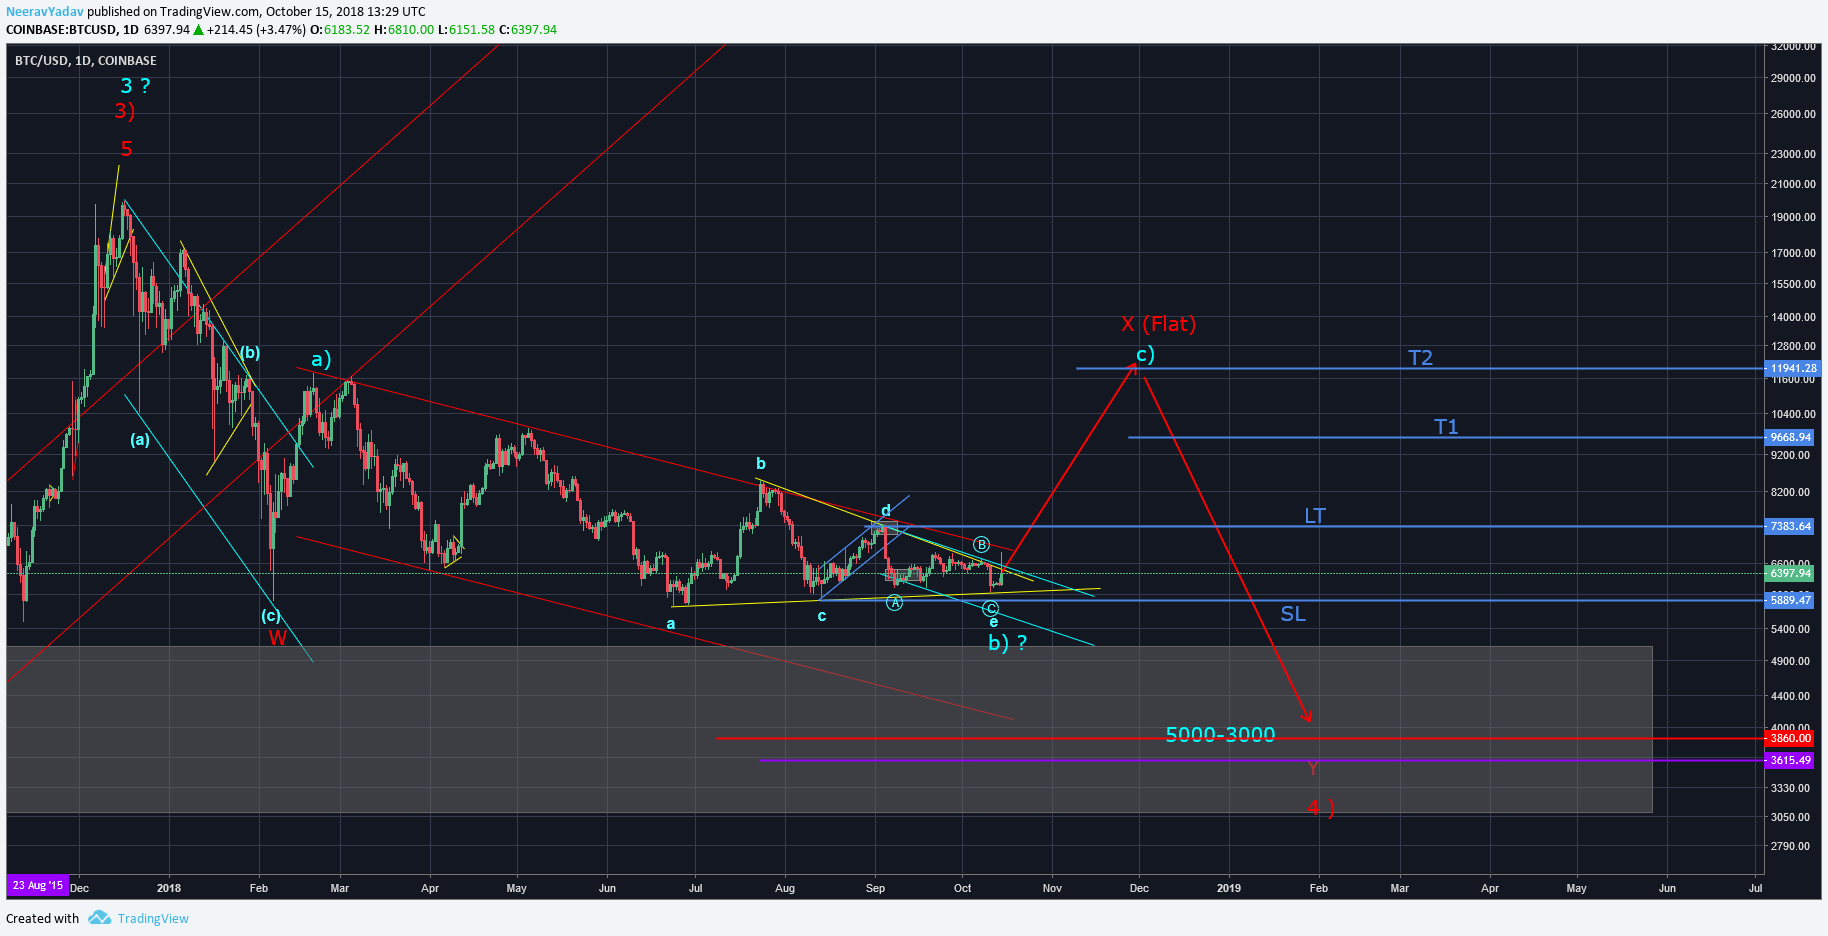
The Triangle seems to be in Wave b) of Wave X which seems to be moving as a Flat structure. A clear break above the Wave d high of this Triangle would suggest that we can see higher level as specified on the chart, however if we see a Invalidaiton of this pattern, that is market going below the Wave c low of this Triangel then that would serve as a Stop loss for any longs and we can expect lower levels into the white support zone present on the chart.
As such this pattern is providing trading opportunities for both sides with adequate stop levels and hence should be paid attention to.
Author

Neerav Yadav
50 Eyes Market Analysis
Neerav Yadav is a Futures trader who is in the markets since 2014 and trades primarily in Energy Futures, Gold, Indices, Stocks and other instruments.


