Bitcoin Elliott Wave technical analysis [Video]
![Bitcoin Elliott Wave technical analysis [Video]](https://editorial.fxsstatic.com/images/i/BTC-neutral-object_XtraLarge.png)
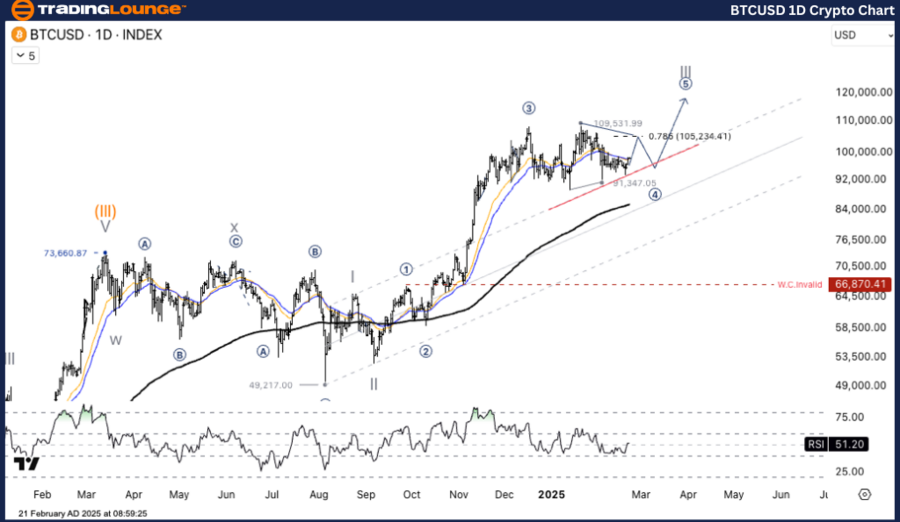
Elliott Wave Analysis TradingLounge Daily Chart.
Bitcoin/ U.S. Dollar (BTCUSD).
BTC/USD Elliott Wave technical analysis
-
Function: Counter Trend.
-
Mode: Corrective.
-
Structure: Triangle.
-
Position: Wave (D).
-
Next higher degree direction: Wave ((4)).
-
Invalidation level: -
-
Details: Bitcoin's price is in the final stages of a Triangle Correction (A-B-C-D-E), which is a 4-wave correction phase.
Bitcoin/US Dollar (BTC/USD) trading strategy
The market is currently in the late stage of a Triangle Correction (A-B-C-D-E) within Wave 4. BTCUSD is expected to be forming Wave D, moving upwards to test the key resistance level at 105,234 USD (Fib 0.786). Following this, a potential correction to Wave E may occur before entering a major uptrend in Wave 5, extending into Wave III.
Trading strategies
-
Strategy:
-
Long Strategy:
-
Consider buying at 96,500 USD if a reversal signal appears.
-
-
-
Risk Management:
-
Invalidation Point: Cut losses if the price drops below 91,347 USD.
-
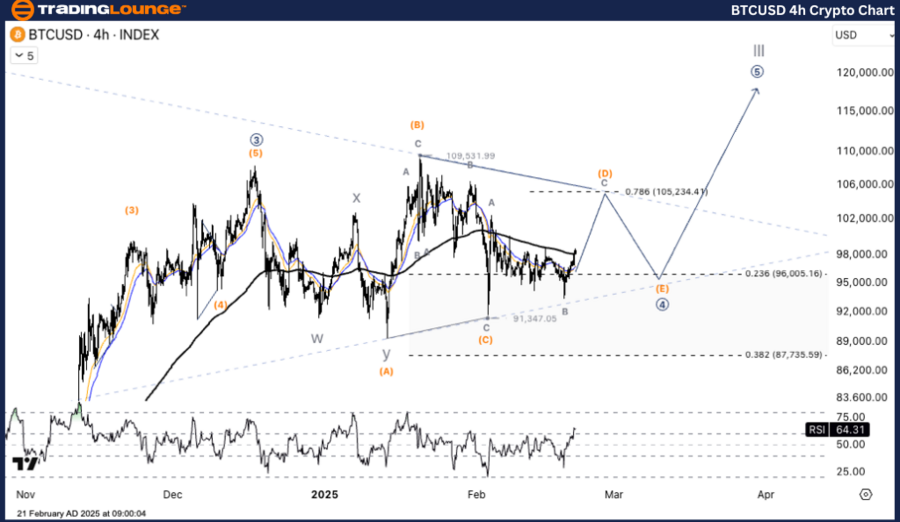
Elliott Wave Analysis TradingLounge H4 Chart.
Bitcoin/ U.S. Dollar (BTCUSD).
BTC/USD Elliott Wave technical analysis
-
Function: Counter Trend.
-
Mode: Corrective.
-
Structure: Triangle.
-
Position: Wave (D).
-
Next higher degree direction: Wave ((4)).
-
Invalidation level: -
-
Details: Bitcoin's price is currently in the final stages of a Triangle Correction (A-B-C-D-E), forming part of a 4-wave corrective structure.
Bitcoin/US Dollar (BTC/USD) trading strategy
The price remains in the late stage of the Triangle Correction (A-B-C-D-E) within Wave 4. BTCUSD is projected to be in Wave D, rising to test the major resistance at 105,234 USD (Fib 0.786). A retracement to Wave E could occur before the market resumes an uptrend into Wave 5, progressing into Wave III.
Trading strategies
-
Strategy:
-
Long Strategy:
-
Consider buying at 96,500 USD if a reversal signal is confirmed.
-
-
-
Risk Management:
-
Invalidation Point: Exit positions if the price falls below 91,347 USD.
-
TradingLounge analyst: Kittiampon Somboonsod, CEWA.
BTC/USD Elliott Wave technical analysis [Video]
Author

Peter Mathers
TradingLounge
Peter Mathers started actively trading in 1982. He began his career at Hoei and Shoin, a Japanese futures trading company.


