|

Bitcoin Cash (BCH) has the opportunity of potential springboard - Technical Analysis

  • Bitcoin Cash price late on Thursday is trading in the red, down some 0.80%. 
  • BCH/USD price is gunning for a retest of a breached descending wedge formation.
  • Should the upper part of the pattern remain intact, then the bulls could use this as a platform to spring higher. 

Spot rate:                

Relative change:      -0.85%

High:                        132.71

Low:                         129.44

Trend:                       Bearish/Neutral

Trends:
    Daily SMA20: 132.6837
    Daily SMA50: 126.13
    Daily SMA100: 135.7495
    Daily SMA200: 309.32
Levels:
    Previous Daily High: 133.068
    Previous Daily Low: 128.5558
    Previous Weekly High: 156.9334
    Previous Weekly Low: 125.1897
    Previous Monthly High: 156.9334
    Previous Monthly Low: 109.9144
    Daily Fibonacci 38.2%: 130.2795
    Daily Fibonacci 61.8%: 131.3444
    Daily Pivot Point S1: 128.5938
    Daily Pivot Point S2: 126.3187
    Daily Pivot Point S3: 124.0816
    Daily Pivot Point R1: 133.106
    Daily Pivot Point R2: 135.3431
    Daily Pivot Point R3: 137.6182

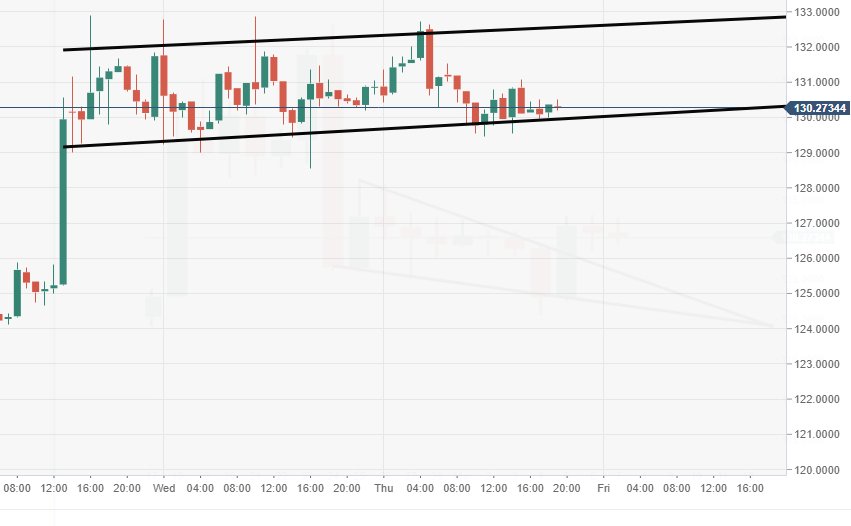
BTC/USD 60-minute chart

  • Price action via the 60-minute chart is moving within somewhat of a bullish flag pattern.
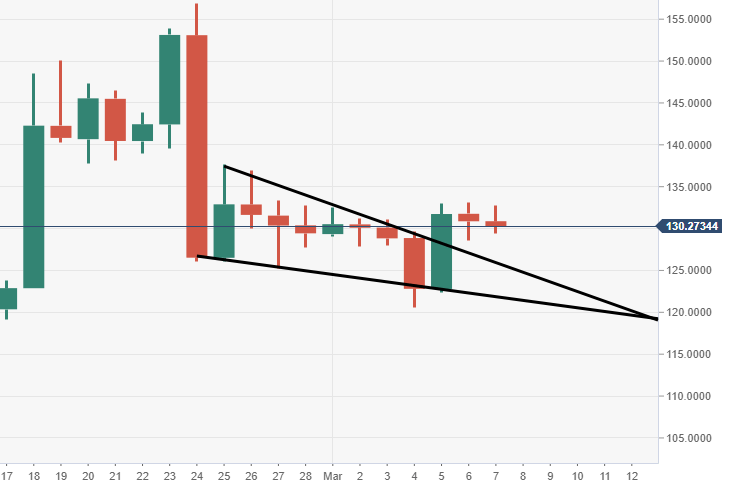
BTC/USD daily chart

  • Bears are making good way for a retest of the breached descending wedge formation. 

Author

Ken Chigbo

Ken Chigbo

Independent Analyst

Ken has over 8 years exposure to the financial markets. He started his career as an analyst, covering a variety of asset classes; forex, fixed income, commodities and equities.

More from Ken Chigbo
Share:

Editor's Picks

Ripple bulls defend key support amid waning retail demand and ETF inflows

XRP ticks up above $1.40 support, but waning retail demand suggests caution. XRP attracts $4 million in spot ETF inflows on Thursday, signaling renewed institutional investor interest.

Crypto Today: Bitcoin, Ethereum, XRP rebound as risk appetite improves

Bitcoin rises marginally, nearing the immediate resistance of $68,000 at the time of writing on Friday. Major altcoins, including Ethereum and Ripple, hold key support levels as bulls aim to maintain marginal intraday gains.

Bitcoin Weekly Forecast: No recovery in sight 

Bitcoin price continues to trade sideways between $65,729 and $71,746, extending its consolidation since February 7. US-spot ETFs record an outflow of $403.90 million through Thursday, pointing to the fifth consecutive week of withdrawals.

Pi Network Price Forecast: PI recovery stalls amid profit-taking

Pi Network tests 50-day EMA support on Friday, after a 5% decline the previous day. PiScan data shows large deposits on CEXs totaling over 4 million PI tokens in the last 24 hours, reflecting an exodus of investors taking profits.

Bitcoin Price Annual Forecast: BTC holds long-term bullish structure heading into 2026

Bitcoin (BTC) is wrapping up 2025 as one of its most eventful years, defined by unprecedented institutional participation, major regulatory developments, and extreme price volatility.

Bitcoin: No recovery in sight

Bitcoin (BTC) price continues to trade within a range-bound zone, hovering around $67,000 at the time of writing on Friday, and falling slightly so far this week, with no signs of recovery.