|

Bitcoin Elliott Wave technical analysis [Video]

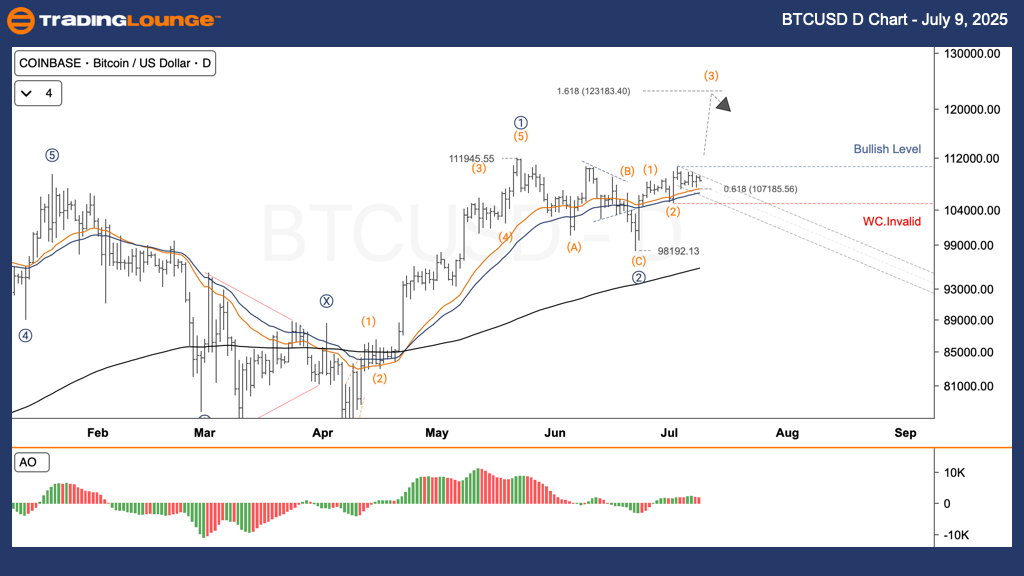
BTC/USD Elliott Wave technical analysis – Daily chart

  • Function: Follow Trend.

  • Mode: Motive.

  • Structure: Impulse.

  • Position: Wave 3.

  • Direction: Next higher degrees expected to continue upward.

Bitcoin (BTC/USD) trading strategy

After BTC surpassed $110,590 to complete wave (1), it's now consolidating in wave (2) ABC, with sub-wave C testing a key support level before wave (3) likely resumes to the upside.

Trading strategies

For short-term traders (swing trade):

  • Aggressive entry: If BTC falls into the $107,200–$106,300 zone and shows a bullish reversal signal (e.g., bullish engulfing pattern, RSI divergence).

  • Conservative entry: Wait for confirmation with BTC closing above $110,600, indicating wave (3) has resumed.

Wave count invalidation:

  • Invalidation level: $105,149.53.

  • If BTC drops below this price, the wave count becomes invalid.

Chart

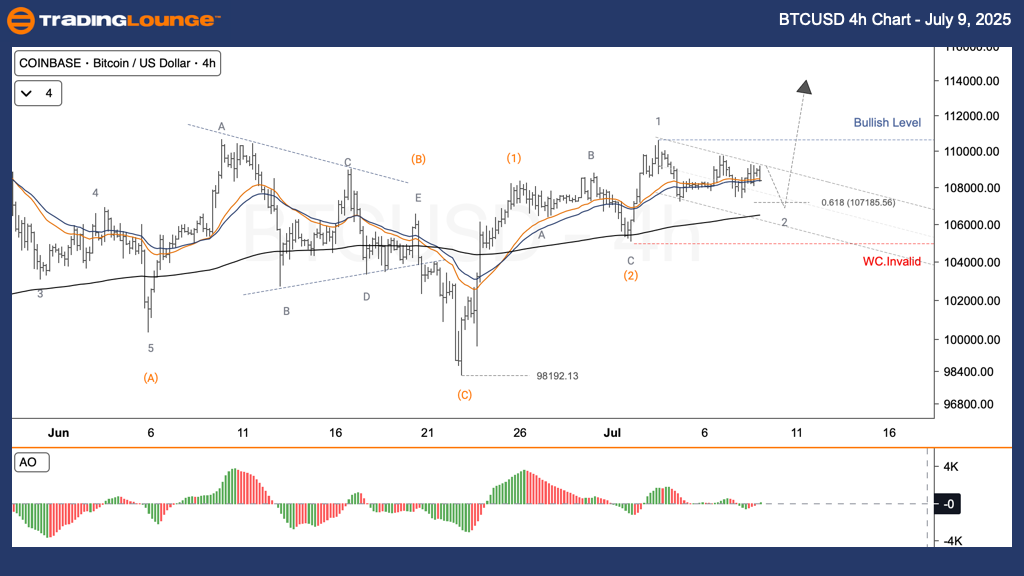
BTC/USD Elliott Wave technical analysis – Four-hour chart

  • Function: Follow Trend.

  • Mode: Motive.

  • Structure: Impulse.

  • Position: Wave 3.

BTC price outlook

Post the breakout above $110,590, the asset has entered an ABC corrective phase for wave (2). Sub-wave C is testing crucial support. A rebound from this area is likely to begin wave (3) higher.

Trading strategies – Summary

For short-term traders (swing trade):

  • Aggressive entry: Enter between $107,200–$106,300 if a bullish pattern appears.

  • Conservative entry: Confirm breakout above $110,600 to enter.

Invalidation point:

  • $105,149.53 – Falling below this invalidates the current wave count.
Chart

Bitcoin (BTC/USD) Elliott Wave technical analysis [Video]

Author

Peter Mathers

Peter Mathers

TradingLounge

Peter Mathers started actively trading in 1982. He began his career at Hoei and Shoin, a Japanese futures trading company.

More from Peter Mathers
Share:

Editor's Picks

Bitcoin price slips below $67,000 ahead of US Nonfarm Payrolls data

Bitcoin price extends losses, and trades below the lower consolidating boundary at $67,300 at the time of writing. A firm close below this level could trigger a deeper correction for BTC. Despite the weakness in price action, institutional demand shows signs of support, recording mild inflows in ETFs so far this week.

Robinhood's fourth-quarter earnings miss estimates as crypto revenue falls

Retail investment platform Robinhood (HOOD) posted fourth-quarter revenue of $1.28 billion, a 27% year-over-year increase that nonetheless fell short of Wall Street's estimate of $1.35 billion, as a slump in crypto trading activity weighed on results.

Solana recovery falters as bearish market sentiment weighs in

Solana (SOL) struggles to sustain its recovery, retracing toward $80 at press time on Wednesday after losing over 4% the previous day. The high-speed blockchain retains interest among institutional investors, and maintains liquidity amid rising stablecoin supply.

Top 3 Price Prediction: Bitcoin, Ethereum, Ripple – BTC, ETH and XRP show no sign of recovery

Bitcoin (BTC), Ethereum (ETH), and Ripple (XRP) show signs of cautious stabilization on Wednesday after failing to close above their key resistance levels earlier this week. BTC trades below $69,000, while ETH and XRP also encountered rejection near major resistance levels.

Bitcoin Price Annual Forecast: BTC holds long-term bullish structure heading into 2026

Bitcoin (BTC) is wrapping up 2025 as one of its most eventful years, defined by unprecedented institutional participation, major regulatory developments, and extreme price volatility.

Bitcoin: The worst may be behind us

Bitcoin (BTC) price recovers slightly, trading at $65,000 at the time of writing on Friday, after reaching a low of $60,000 during the early Asian trading session. The Crypto King remained under pressure so far this week, posting three consecutive weeks of losses exceeding 30%.