Solana Price Forecast: Recovery falters as bearish market sentiment weighs in
- Solana hovers above $80 on Wednesday after dropping over 4% the previous day, showing no sign of recovery.
- Stablecoin supply on Solana grew roughly 14% in the last seven days, while SOL ETFs recorded $8.43 million in inflows on Tuesday.
- Derivatives data suggests a bearish bias among retail traders, as SOL futures Open Interest declines amid large long-side liquidations.

Solana (SOL) struggles to sustain its recovery, retracing toward $80 at press time on Wednesday after losing over 4% the previous day. The high-speed blockchain retains interest among institutional investors and maintains liquidity amid rising stablecoin supply, but loses retail strength as derivatives data indicates a decline in futures Open Interest and a sell-side dominance among traders. The technical outlook for Solana indicates bearish dominance, putting pressure on the $80 support level.
Risk-off market sentiment boosts Solana’s on-chain liquidity
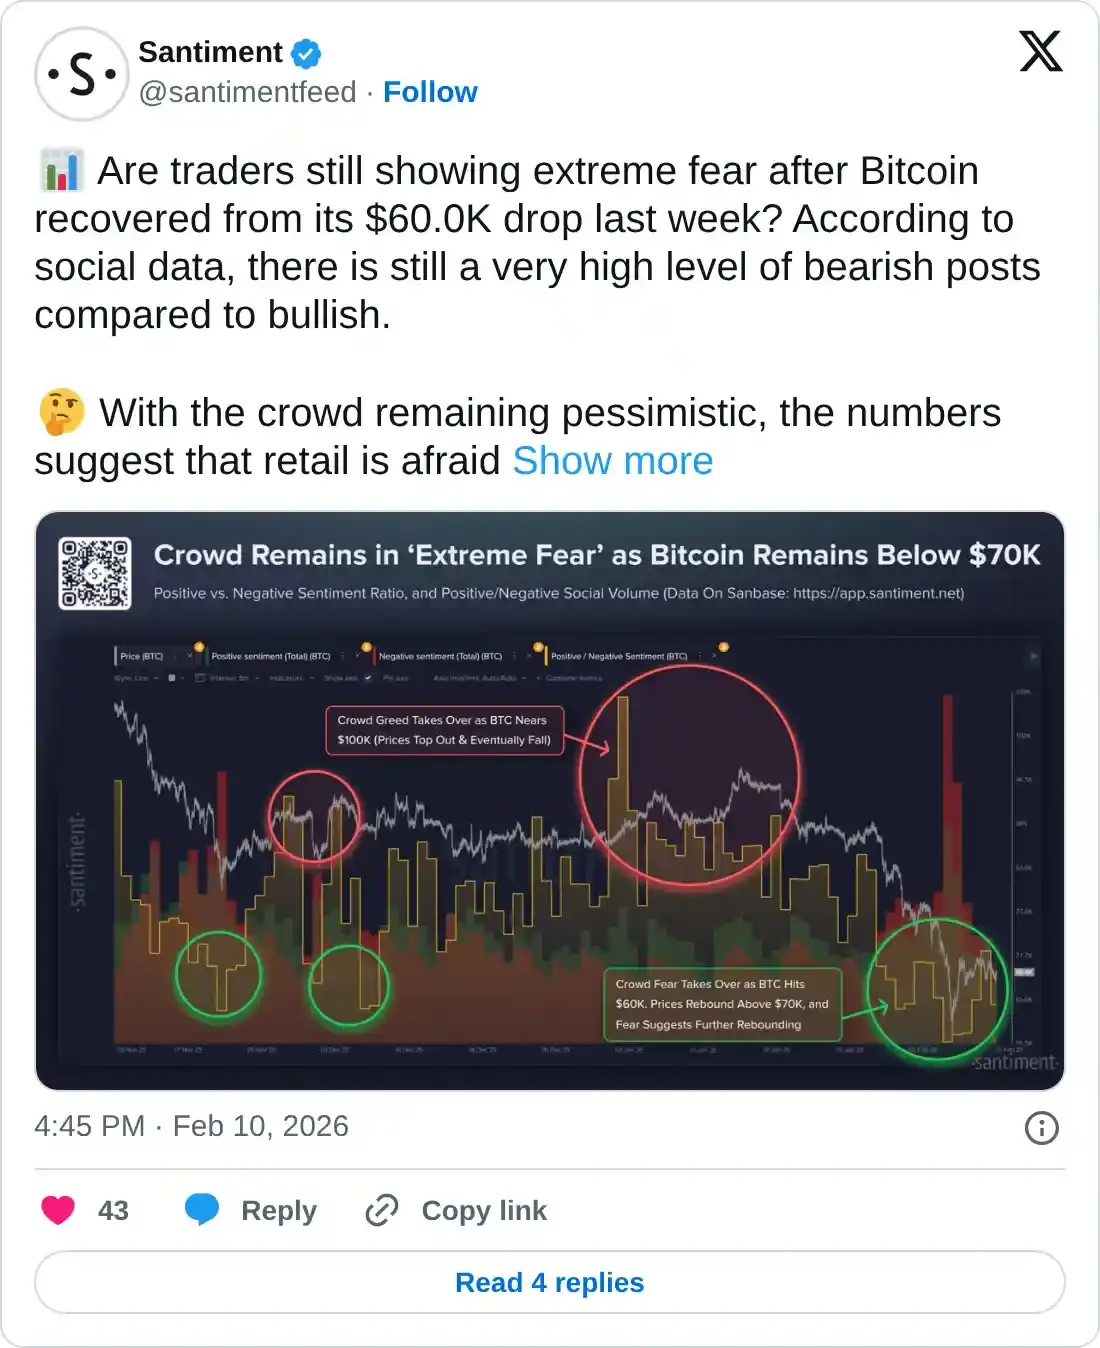
Santiment data indicates that broader market risk-off sentiment prevails as Bitcoin remains below $70,000, thereby adding downside pressure on altcoins, including Solana. However, historically, a surge in Fear, Uncertainty, and Doubt (FUD) in the cryptocurrency market often coincides with sharp rebounds.
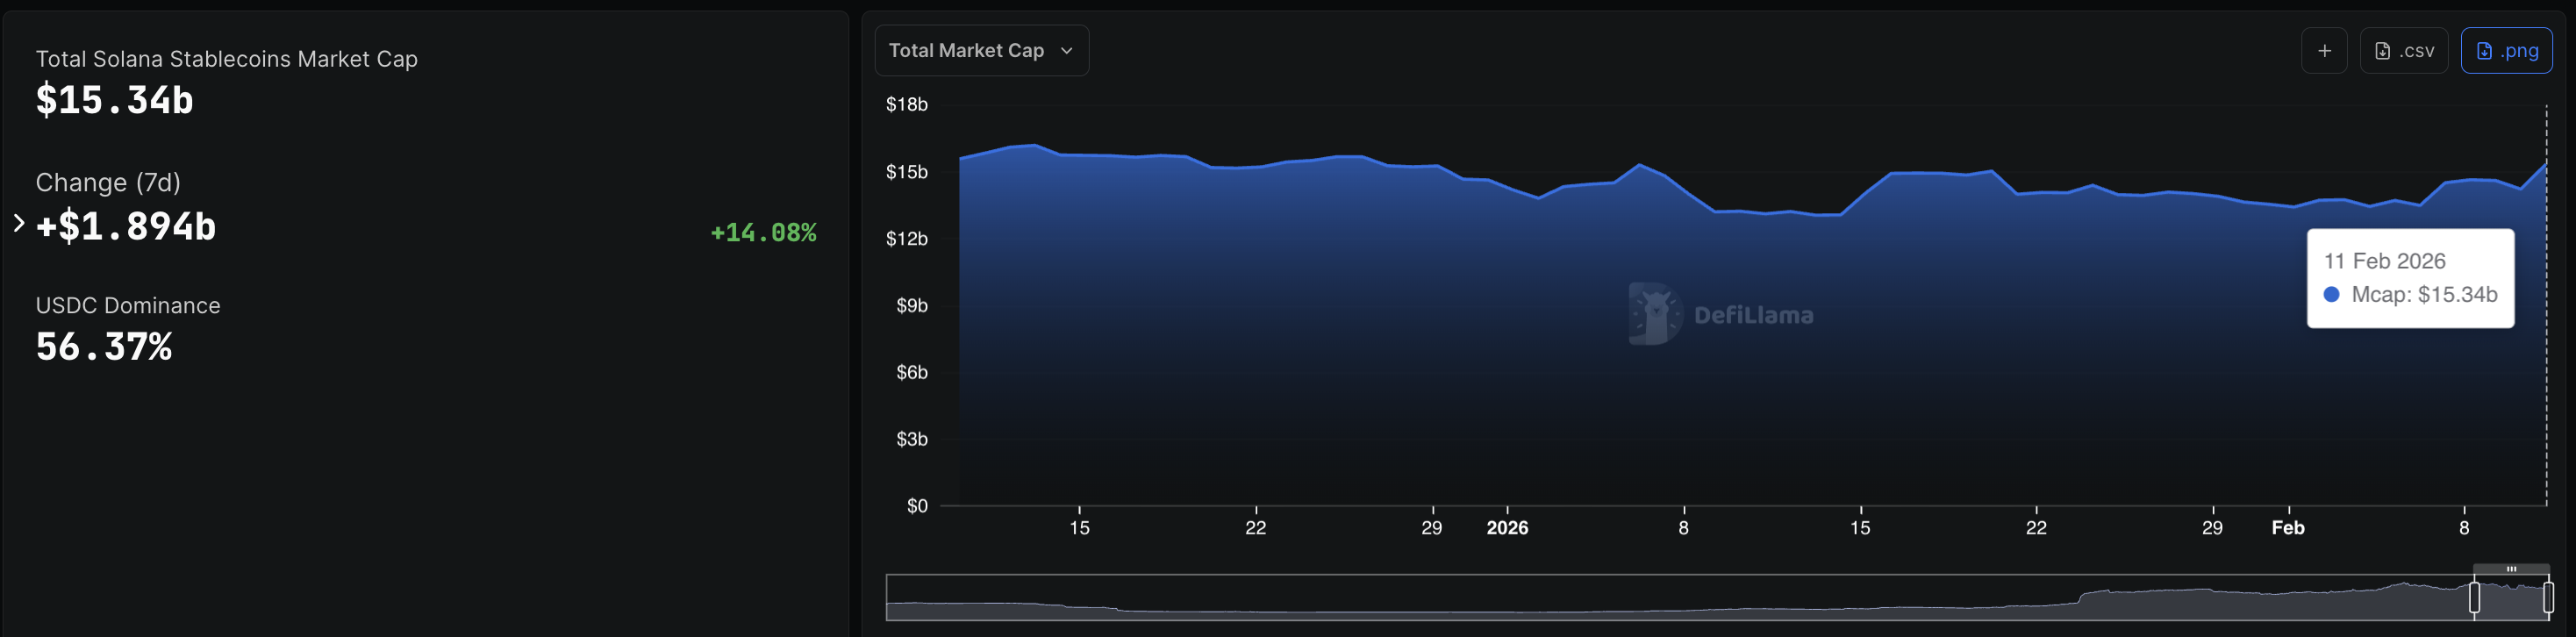
Solana’s broader market structure, including on-chain activity, institutional flows, and derivatives activity, flashes mixed signals. DeFiLlama data indicates that the stablecoin supply has increased by approximately 14% over the past seven days, reaching $15.34 billion, as traders likely swapped volatile tokens for stablecoins, indicating risk-off sentiment. Still, the capital remaining on-chain as dry powder reflects user confidence in the layer-1 blockchain.
Retail side suffers losses as institutional investors go shopping
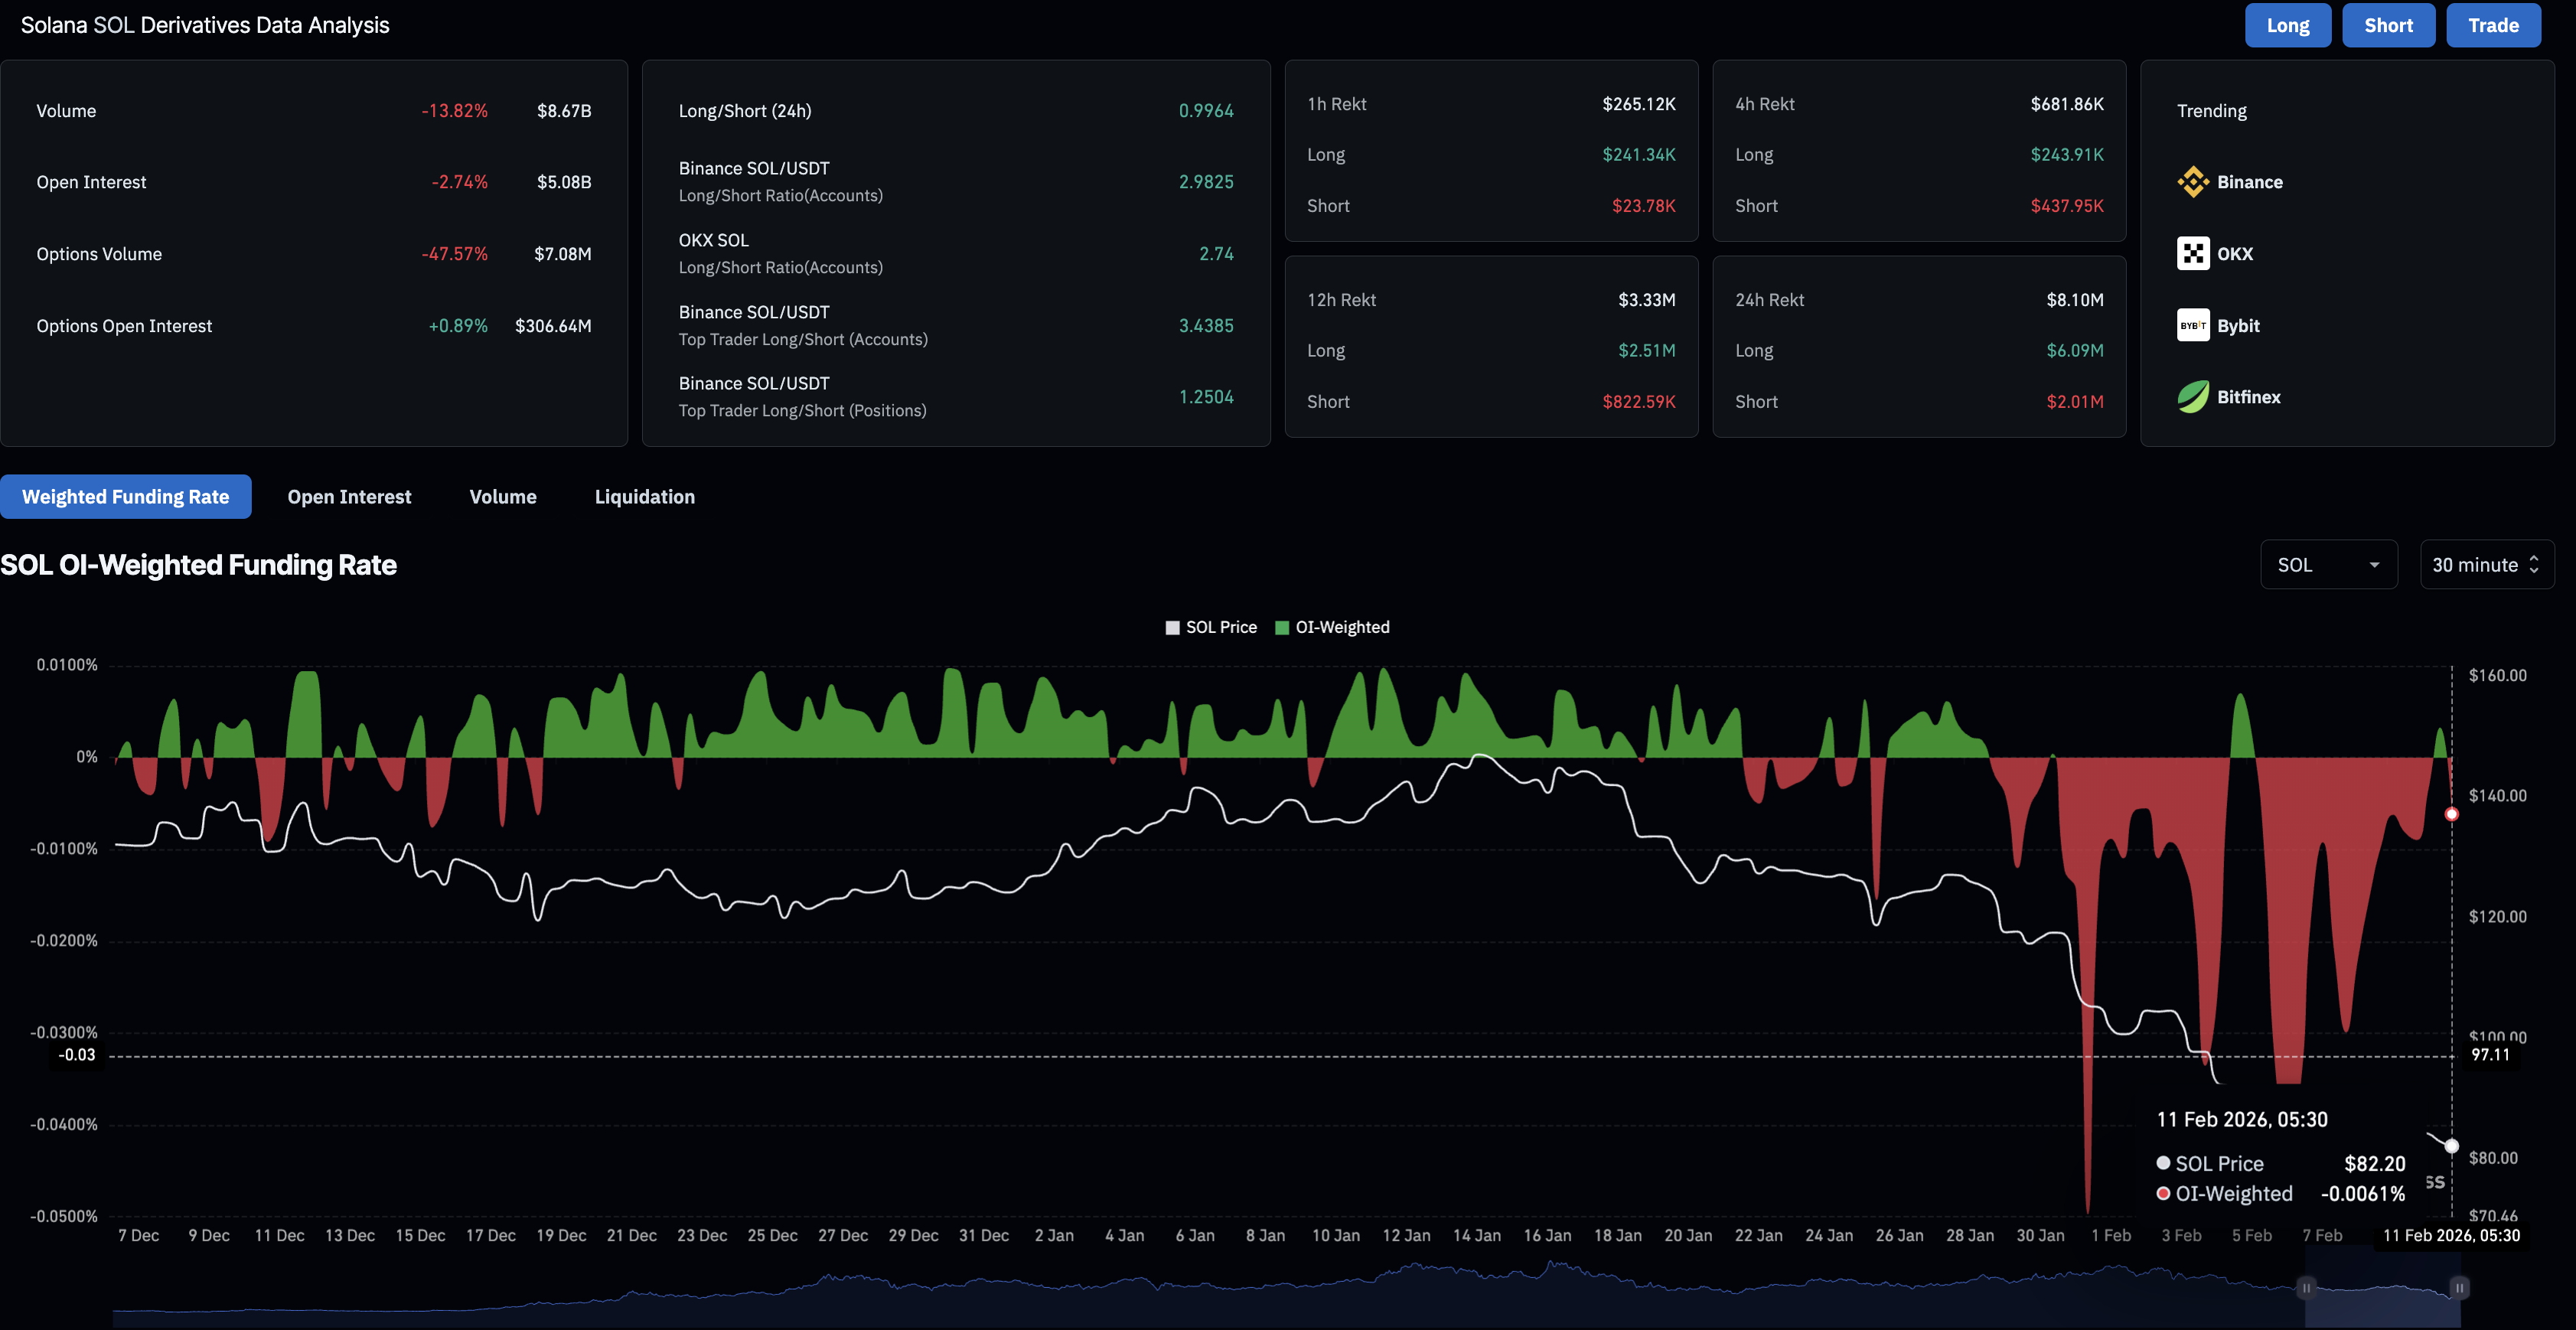
On the derivatives side, CoinGlass data shows that SOL futures Open Interest (OI) decreased by 2.74% over the last 24 hours to $5.08 billion, indicating capital outflows and reinforcing risk-averse sentiment among traders.
Consistent with declining sentiment, long liquidations over the same period totaled $6.09 million, outpacing short liquidations of $2.01 million, reflecting a bearish bias. Meanwhile, the funding rate of -0.0061% confirms increased short-side interest, as traders are willing to pay a premium to hold bearish positions.
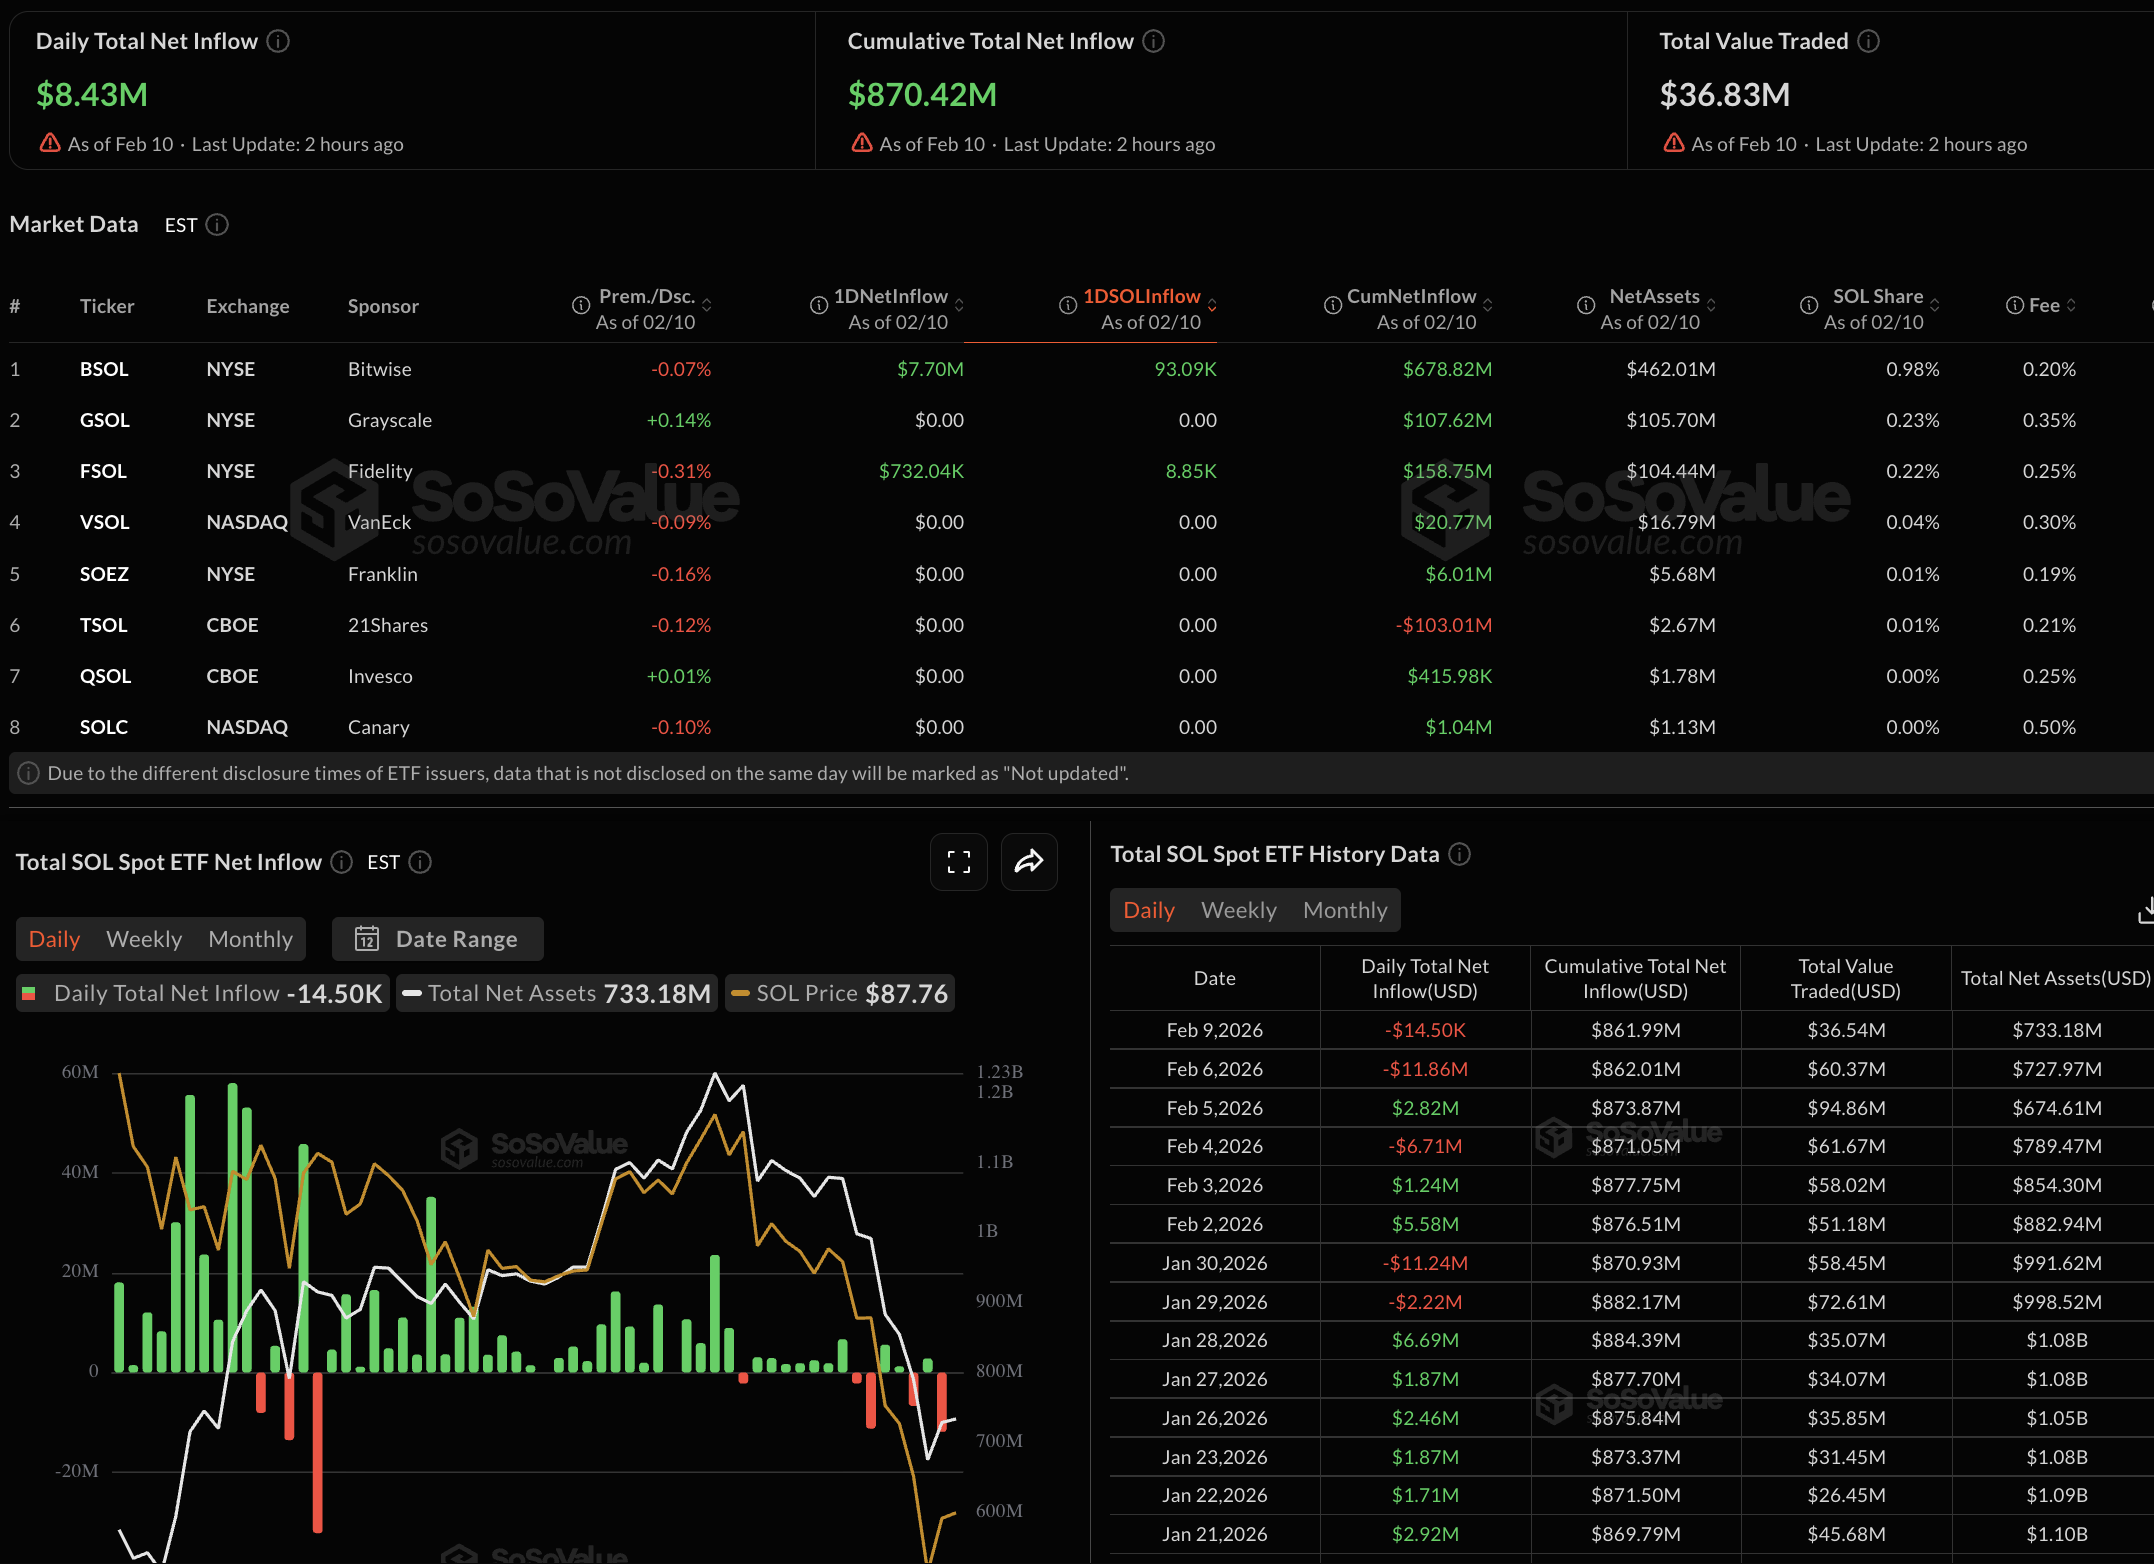
The institutional demand survives for Solana as US spot SOL Exchange-Traded Funds (ETFs) recorded $8.43 million in inflows on Tuesday. Steady inflows at lower levels could help Solana bottom out and prepare for a trend reversal.
Technical outlook: Will Solana bottom out above $80?
Solana trades at $82 at press time on Wednesday, approaching $80 as downside pressure adds deadweight on its recovery. SOL is well below the 50-day Exponential Moving Average (EMA), which is sloping lower, indicating a bearish structure. The 200-day EMA also trends down, reinforcing the broader downside bias.
The Moving Average Convergence Divergence (MACD) and signal line lose downtrend momentum on the daily chart as the negative histogram contracts, suggesting that bearish momentum is fading. However, the MACD is a lagging indicator and could extend the decline as selling pressure weighs in.
The Relative Strength Index (RSI) is at 27 on the same chart, indicating an oversold condition and hinting at a potential rebound.
The Fibonacci trend-extension tool, measured between the September 18 high at $253, the December 18 low at $116, and the January 13 high at $148, suggests that the crucial support for Solana lies at the 50% retracement level at $80. If SOL breaks below $80, it would open the door to the 61.8% and 78.6% Fibonacci extension levels at $64 and $41, respectively.
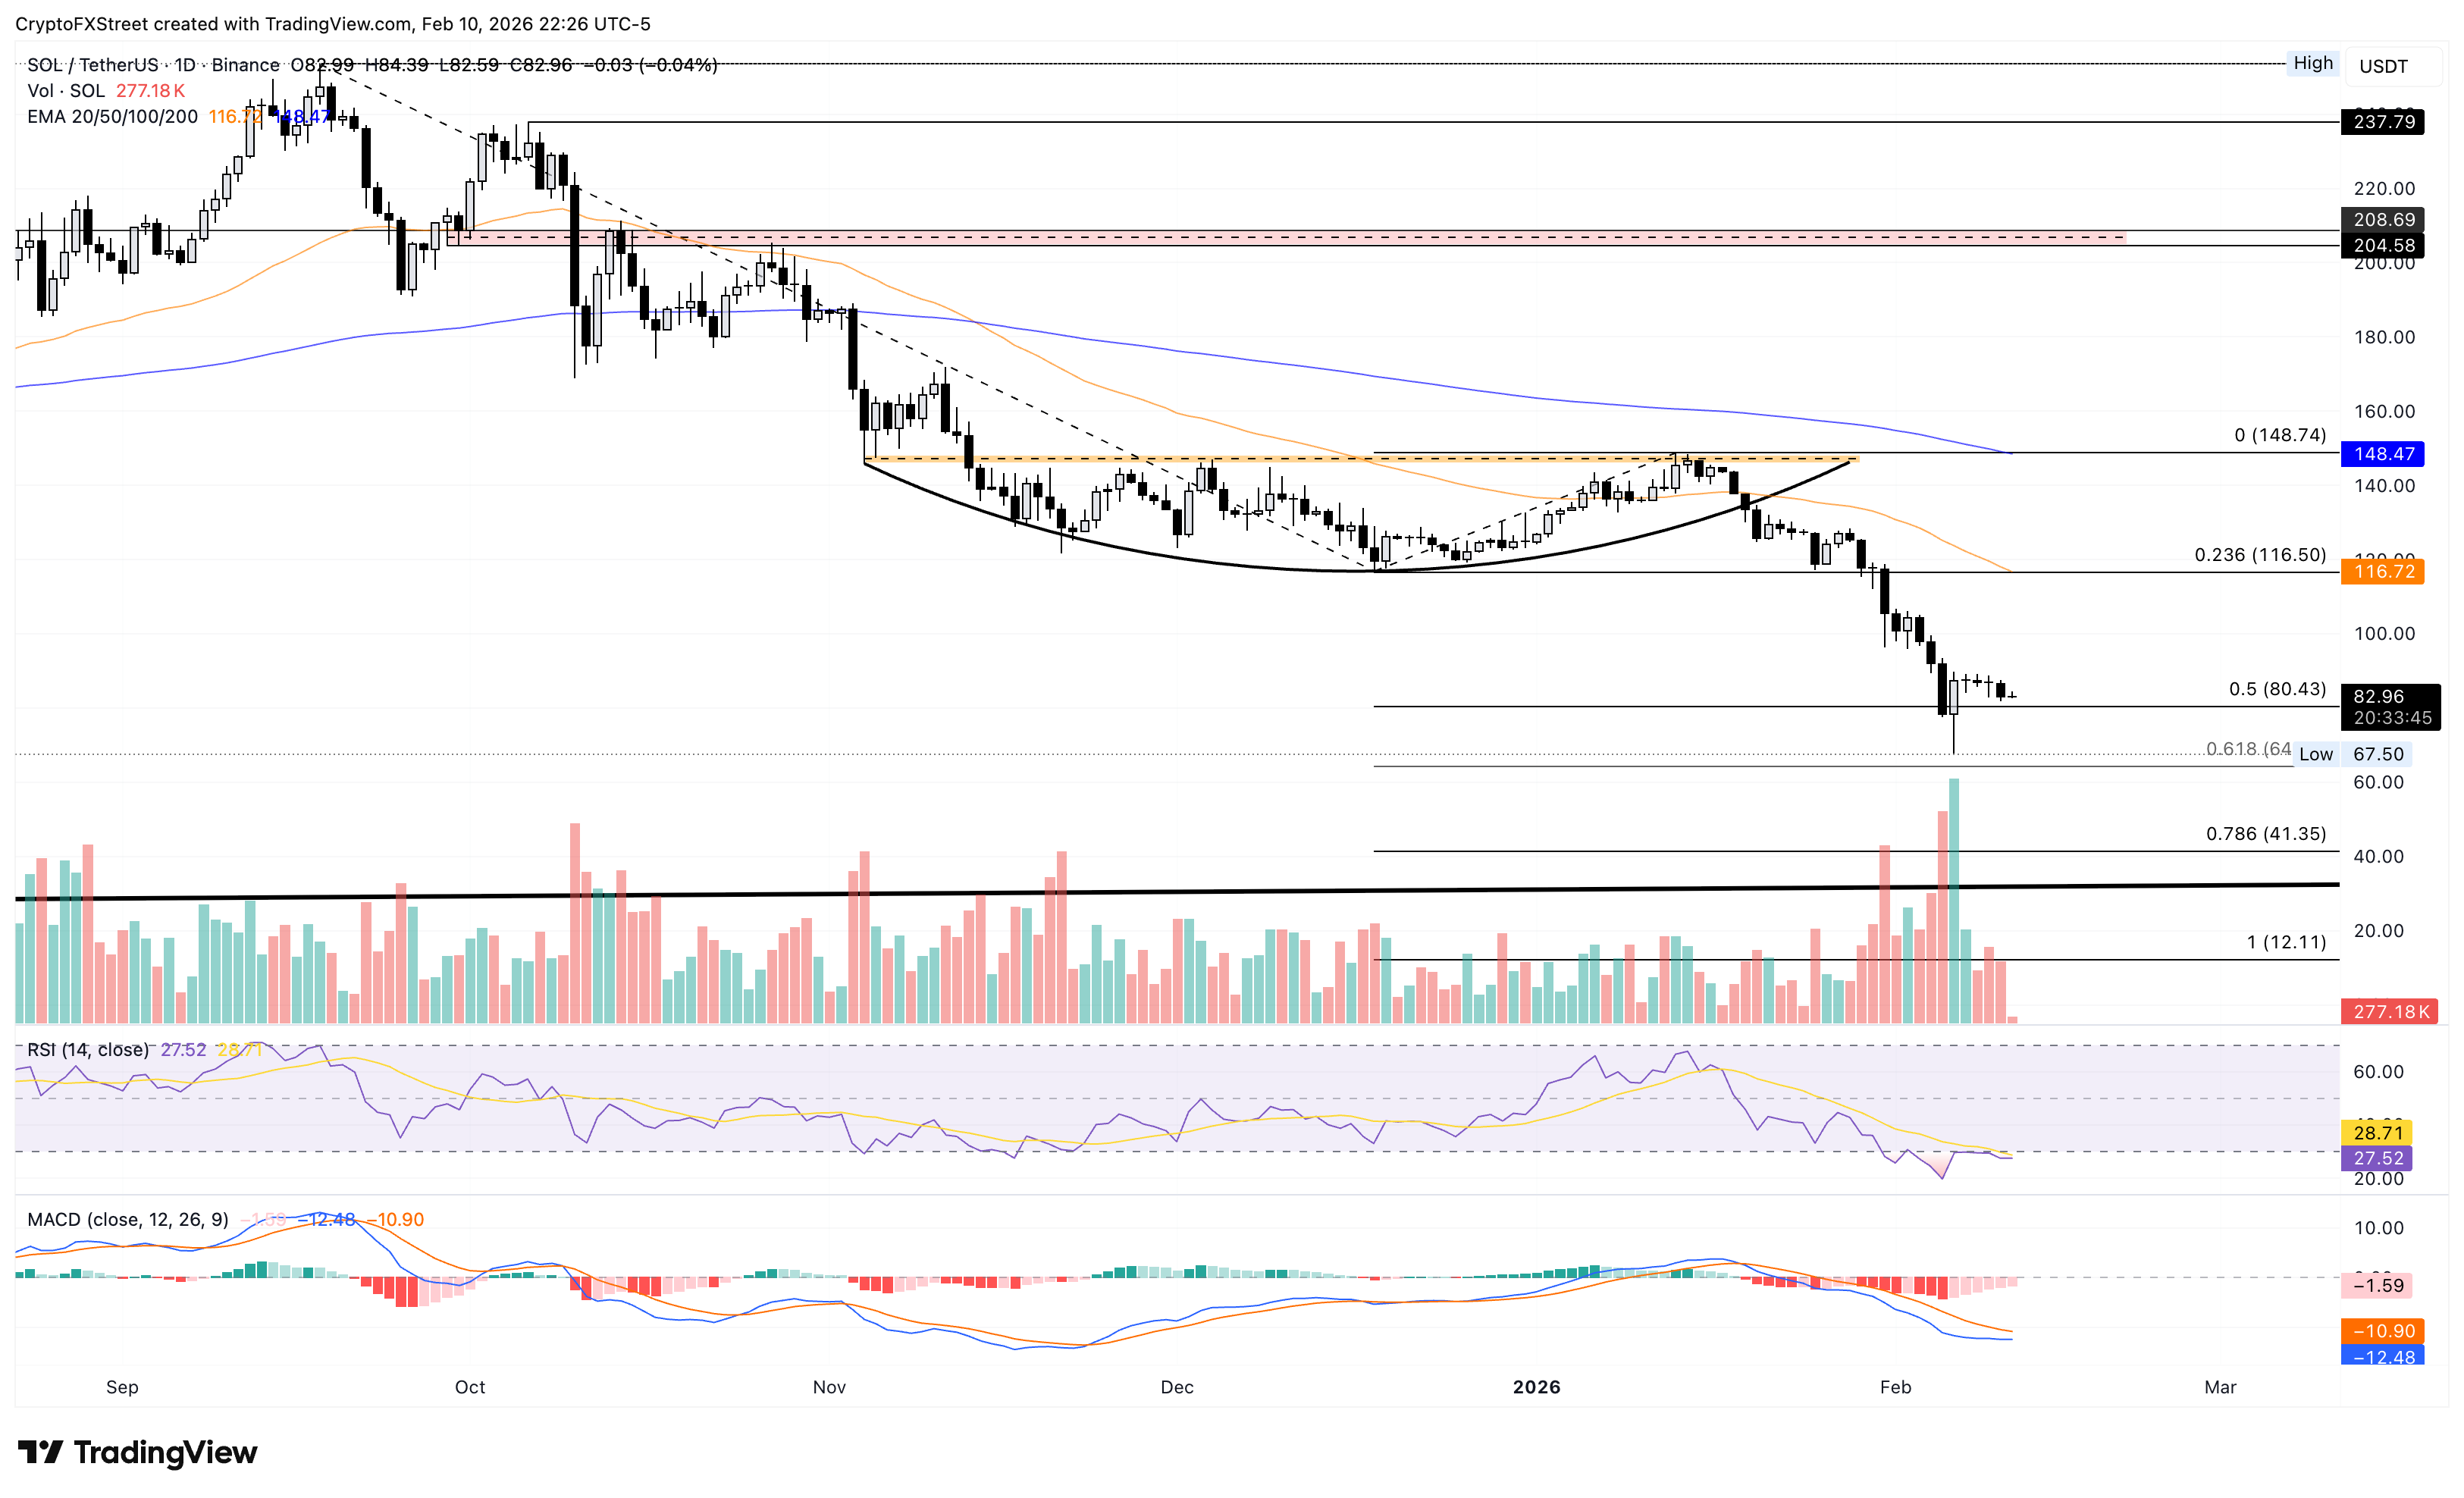
On the upside, the immediate resistance for Solana lies at the 50-day and 200-day EMAs at $116 and $148, respectively.
(The technical analysis of this story was written with the help of an AI tool.)
Author

Vishal Dixit
FXStreet
Vishal Dixit holds a B.Sc. in Chemistry from Wilson College but found his true calling in the world of crypto.



