|

Band Protocol Price Prediction: BAND is on the brink of a 42% explosion

  • Band Protocol price is contained inside a symmetrical triangle pattern on the 12-hour chart.
  • A breakout or breakdown from this pattern will move the digital asset by up to 42%.
  • It’s not clear in which direction Band is headed, but the bears seem to have the upper hand.

Band Protocol has been under consolidation for the past three weeks after topping out at $11.45 on January 9 and $11.48 on January 16, establishing a potential double top. Currently, BAND is right in the middle of the pattern and awaits a clear signal to move.

Band Protocol price could slip below $5 if this level cracks

On the 12-hour chart, the symmetrical triangle pattern has formed a support trendline at $8. Losing this level can quickly push Band Protocol price down to $4.7, a 42% move which is calculated using the maximum height of the pattern. 

band price

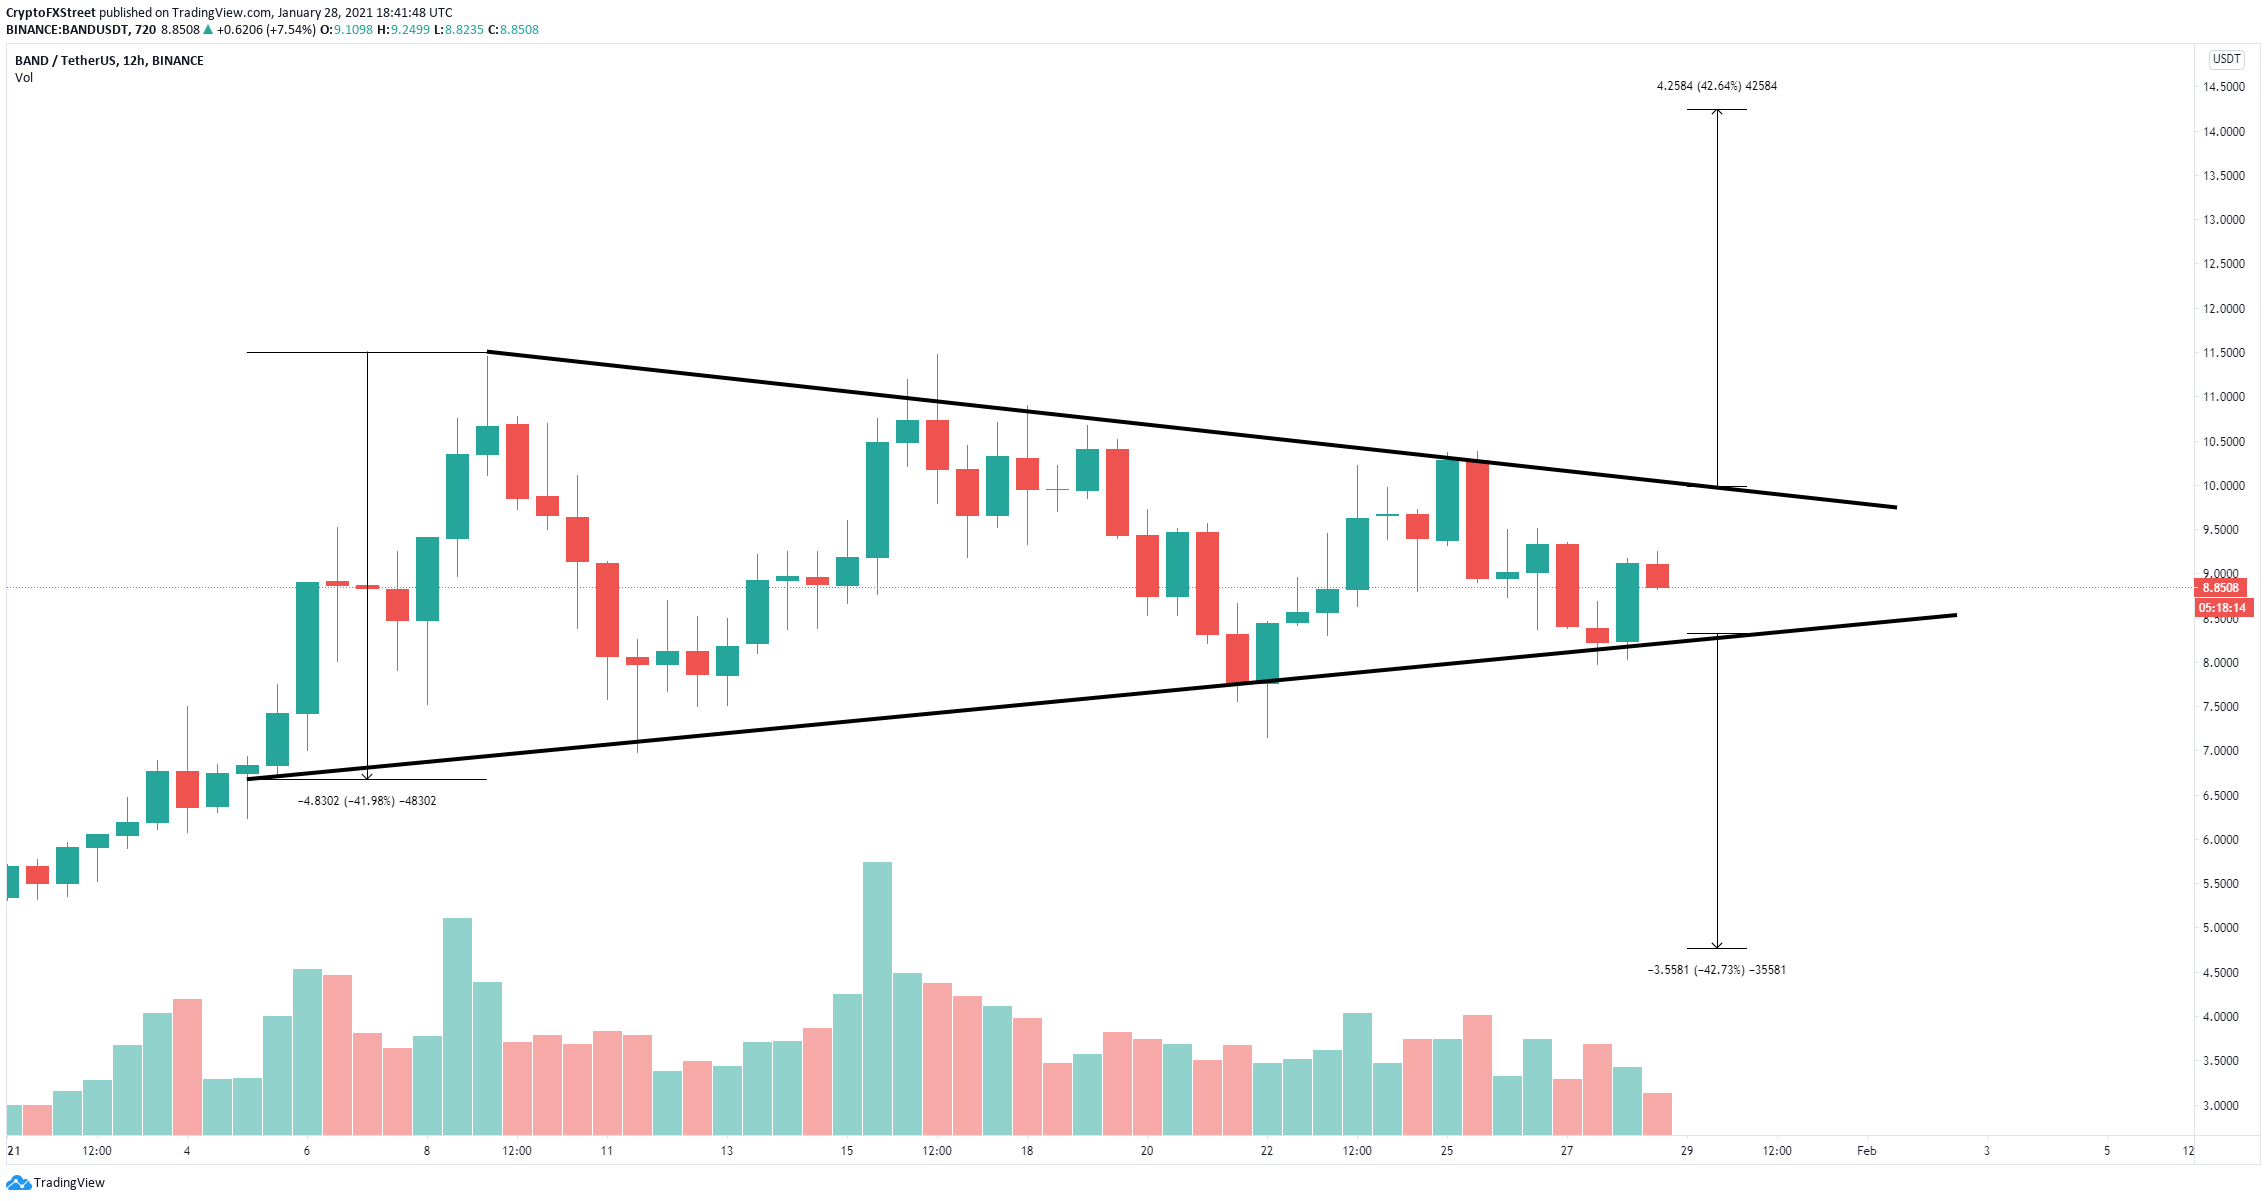
BAND/USD 12-hour chart

The In/Out of the Money Around Price (IOMAP) gives the upper hand to the bears as it shows a lot of resistance ahead. The most significant support area is located between $8.61 and $8.87 with 434,000 BAND in volume. Losing this range of support will push BAND through the $8 support level and below.
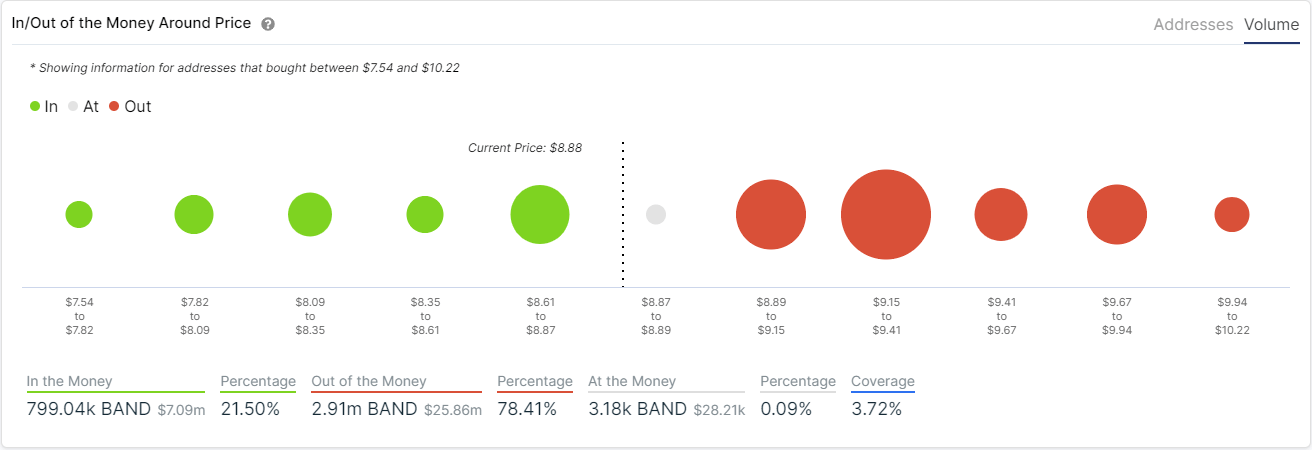
band price

BAND IOMAP chart

The resistance area between $9.15 and $9.41 has 1.4 million BAND in volume, which is substantially higher than the support range below. However, a breakout above this point would be notable and likely drive Band Protocol towards $10 as there is weaker resistance ahead. Cracking this level will also push BAND price by 42% towards $14.

Author

Lorenzo Stroe

Lorenzo Stroe

Independent Analyst

Lorenzo is an experienced Technical Analyst and Content Writer who has been working in the cryptocurrency industry since 2012. He also has a passion for trading.

More from Lorenzo Stroe
Share:

Markets move fast. We move first.

Orange Juice Newsletter brings you expert driven insights - not headlines. Every day on your inbox.

By subscribing you agree to our Terms and conditions.

Editor's Picks

Pi Network Price Forecast: Bearish streak nears critical support trendline

Pi Network (PI) edges lower on Friday for the third consecutive day, approaching a local support trendline. The on-chain data suggests an increase in supply pressure as Centralized Exchanges (CEXs) experience a surge in inflows.

Top Crypto Gainers: Zcash rallies as MYX Finance, Dash test critical EMA levels

Zcash , MYX Finance, and Dash are the top-performing assets in the top 100 cryptocurrency list over the last 24 hours. The privacy coin leads the rally while MYX and DASH struggle to clear their 100-day Exponential Moving Averages (EMA).

XRP slides amid record on-chain activity, mixed technical signals

Ripple is trading under pressure at the time of writing on Thursday, after bulls failed to break the short-term resistance at $2.22. The reversal may extend toward Monday’s low of $1.98, especially if risk-off sentiment persists in the broader cryptocurrency market.

Aster lags recovery as perpetual DEX releases new roadmap on infrastructure, utility and ecosystem 

Aster is consolidating above $1.05 at the time of writing on Thursday, reflecting lethargic sentiment in the broader cryptocurrency market. The token native to the perpetual DEX had recovered from Monday's low of $0.88 but stalled around $1.08 on Wednesday.

Orange Juice Newsletter – Smart insights by real people. Every day.

A free newsletter highlighting key market trends to help traders stay a step ahead. Daily insights on the most relevant trading topics, compiled by our experts in an easy-to-read format so you never miss an important move.

Bitcoin: BTC steadies as data suggests local bottom

Bitcoin (BTC) hovers around $91,000 at the time of writing on Friday, extending its recovery by 5% so far this week. On the institutional front, a modest outflow from US-listed spot Bitcoin Exchange Traded Funds (ETFs) marks a slowdown from previous weeks and signals a reduction in selling pressure, further supporting BTC’s recovery.