S&P 500 shows bullish price volume action despite one concerning red flag [Video]
![S&P 500 shows bullish price volume action despite one concerning red flag [Video]](https://editorial.fxstreet.com/images/Markets/Equities/SP500/wall_street_nyse3-637299021683820849.jpg)
Although the failure scenario is unfolding after the FOMC last week, the characteristics of the pullback as reflected in the price spread and volume suggested a bullish bias for S&P 500. However, one concerning red flag could create the failure case for the bull and traders and investors need to be aware of.
Watch the video to find out how you could anticipate for both the bullish and bearish cases together with the evolving red flag using the Wyckoff method.
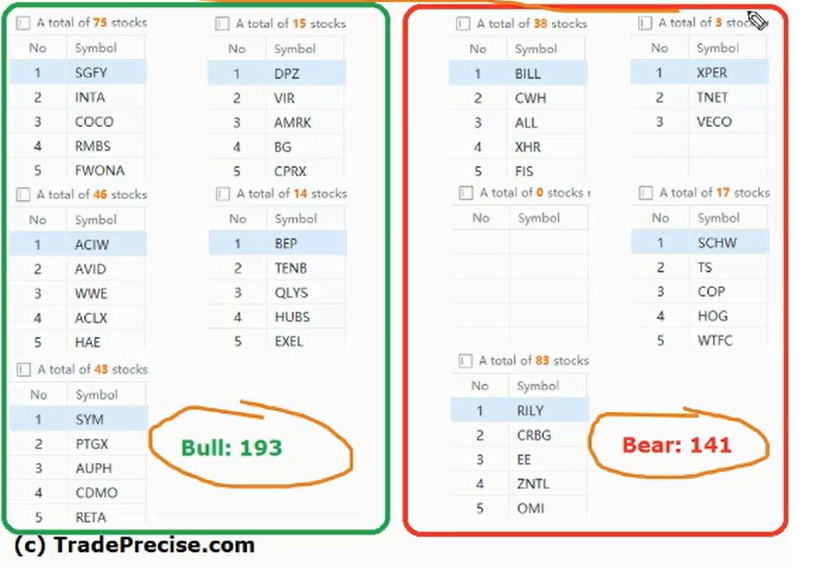
The bullish setup vs. the bearish setup is 193 to 141 from the screenshot of my stock screener below pointed still a negative market environment.
Although there are no shortage of the bullish trade entry setup, especially the technology stocks as tweeted below.
$AMD bullish rounding bottom. Short-term overextended. Sign of strength rally (SOS) pending a backup action. Another strong #semiconductor stock pic.twitter.com/kkeKDU140Y
— Ming Jong Tey (@MingJong) March 25, 2023
Yet it is essential to get the bullish confirmation from the market breadth for a sustainable bull run. The video above is part of the latest Weekly Live Group Coaching Session (1.5 hours) on 28 Mar 2023.
Author

Ming Jong Tey
Independent Analyst
Ming Jong Tey has been trading since 2008. He started his learning journey from technical analysis (indicators, Fibonacci, etc...) to value investing. Throughout his journey, he develops an interest in price action with chart pattern trading.


