XAU/USD Weekly Forecast: Gold buyers eying US employment and inflation updates
- The Federal Reserve trimmed the benchmark rate for the third time in the year in December.
- United States employment and inflation data to set the US Dollar direction ahead of year-end.
- XAU/USD is technically bullish and could overcome its record high in the upcoming days.

Gold prices added roughly 3% in the week, flirting with the $4,350 mark on Friday, to finally settle at around $4,330. Despite its safe-haven condition, the bright metal rallied in a risk-on scenario, amid broad US Dollar (USD) weakness.
Gold appreciates as investors bet against the Fed
The Federal Reserve (Fed) announced a 25 basis points (bps) interest rate cut at its last 2025 meeting, reducing the Federal Funds Target Range (FFTR) to 3.50–3.75%, as expected. Out of the 12 voting members, Stephen Miran argued for a 50 bps cut, while Jeffrey Schmid, president of the Federal Reserve Bank of Kansas City, and Austan Goolsbee, president of the Federal Reserve Bank of Chicago, preferred to keep it unchanged.
The decision came with a fresh Summary of Economic Projections (SEP) and the usual Chairman Jerome Powell press conference. Officials revised the median 2026 projection in real GDP growth to 2.3% vs. 1.9% in the September SEP. Inflation is expected to be 2.0% in 2027 vs. 1.9% in September, and 1.9% in 2028 vs. 1.8% projected in September. Regarding employment, projections remained unchanged, while the 2028 estimate was down to 4.2% from 4.3%. Also, Core PCE inflation is now expected to finish 2025 at 3.0%, ease to 2.5% in 2026, to 1% in 2027 and to 2.0% in 2028. Finally, policymakers foresee one rate cut in 2026 and another one in 2027
Powell’s presser revolved around the Fed’s dual mandate: the Chair highlighted that policymakers are juggling to bring inflation down while avoiding unnecessary damage to the labour market. However, he also added that the economy is not overheated and that rate hikes remain off the table.
Market players took some time to assess the mixed announcement, but ended up betting against the Fed: investors expect at least two interest rate cuts in 2026, which led to renewed optimism. High-yielding assets rallied to the detriment of the Greenback. Safe-haven Gold also gained on broad USD weakness.
US Dollar Price Today
The table below shows the percentage change of US Dollar (USD) against listed major currencies today. US Dollar was the weakest against the Canadian Dollar.
| USD | EUR | GBP | JPY | CAD | AUD | NZD | CHF | |
|---|---|---|---|---|---|---|---|---|
| USD | 0.06% | 0.23% | 0.22% | -0.01% | 0.18% | 0.14% | 0.09% | |
| EUR | -0.06% | 0.17% | 0.16% | -0.07% | 0.11% | 0.08% | 0.04% | |
| GBP | -0.23% | -0.17% | -0.02% | -0.24% | -0.06% | -0.09% | -0.14% | |
| JPY | -0.22% | -0.16% | 0.02% | -0.20% | -0.02% | -0.07% | -0.11% | |
| CAD | 0.01% | 0.07% | 0.24% | 0.20% | 0.18% | 0.14% | 0.10% | |
| AUD | -0.18% | -0.11% | 0.06% | 0.02% | -0.18% | -0.04% | -0.08% | |
| NZD | -0.14% | -0.08% | 0.09% | 0.07% | -0.14% | 0.04% | -0.05% | |
| CHF | -0.09% | -0.04% | 0.14% | 0.11% | -0.10% | 0.08% | 0.05% |
The heat map shows percentage changes of major currencies against each other. The base currency is picked from the left column, while the quote currency is picked from the top row. For example, if you pick the US Dollar from the left column and move along the horizontal line to the Japanese Yen, the percentage change displayed in the box will represent USD (base)/JPY (quote).
US employment data in focus
Meanwhile, the United States (US) released some relevant employment figures. On the one hand, the ADP Employment Change 4-week average showed that the private sector added an average of 4,750 jobs per week in the four weeks ending November 22, better than the previous three negative readings.
Also, the number of job openings on the last business day of September stood at 7.658 million, while for October it rose to 7.67 million, the US Bureau of Labor Statistics (BLS) reported in the Job Openings and Labor Turnover Survey (JOLTS) on Tuesday.
Finally, the country released Initial Jobless Claims for the week ended December 6 on Thursday, which unexpectedly jumped to 236K from 192K in the previous week. The reading also surpassed the 220K expected, fueling speculation that the Fed will have to deliver at least two rate cuts in 2026, and hence, further pressuring the US Dollar.
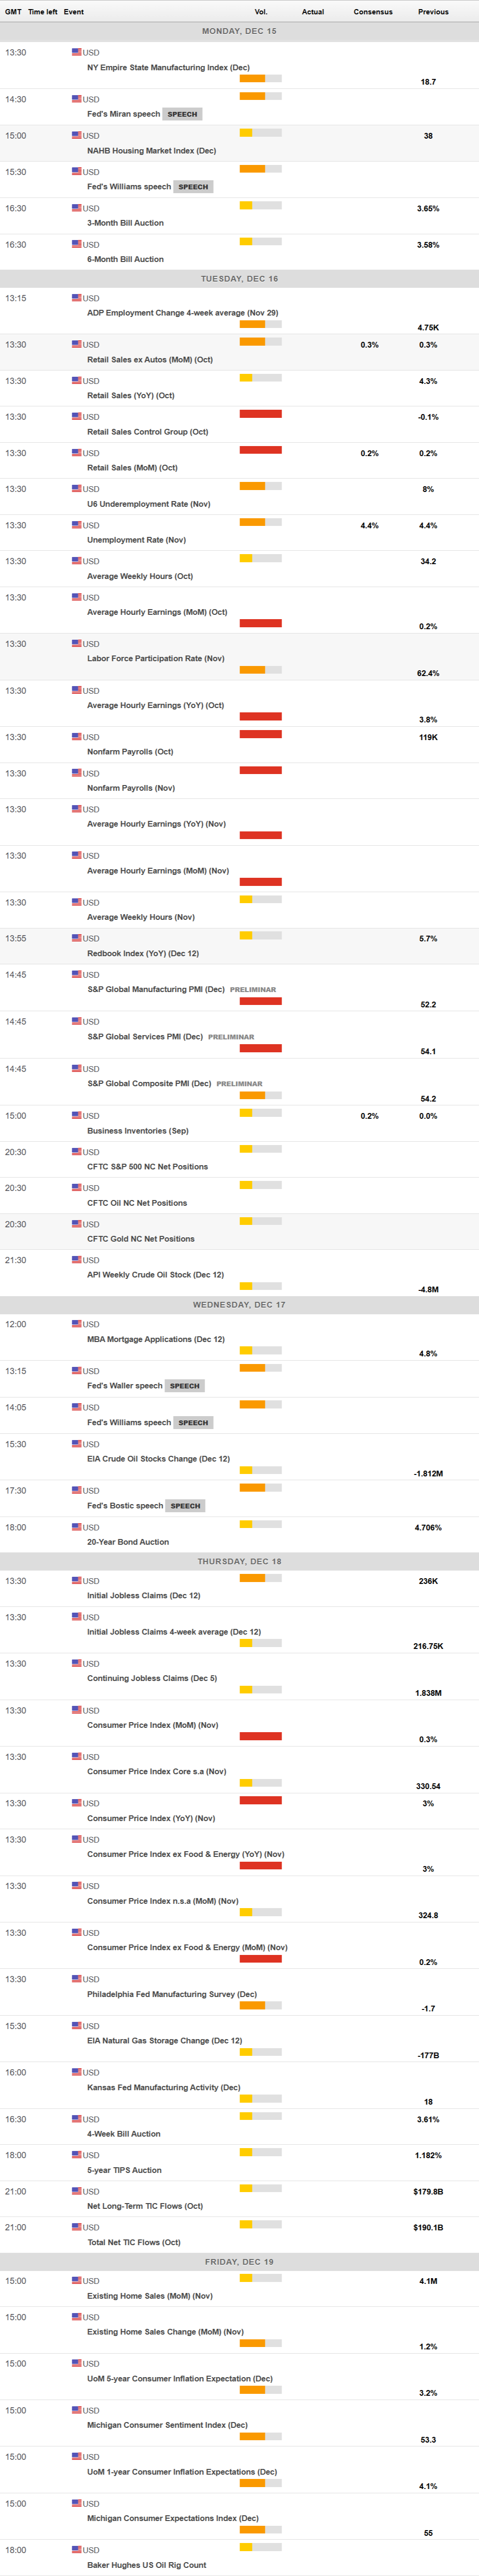
Focus on US first-tier data
In the upcoming days, the US macroeconomic calendar will be quite busy, with employment and inflation figures taking centre stage. Fed speakers will return to the scenario, most likely with hawkish messages. S&P Global will release the preliminary estimates of the December Purchasing Manager’s Indexes (PMIs) on Tuesday. On the same day, the country will release October Retail Sales, expected to rise modestly by 0.3%, and the November Nonfarm Payrolls (NFP) report, which will also include some of the missing October data.
On Thursday, it will be the turn of another weekly unemployment report and fresh Consumer Price Index (CPI) figures. Given that employment and inflation updates will follow and not precede the Fed’s decision, there’s a good chance that such numbers will result in increased volatility ahead of the winter holidays in the northern hemisphere. In the current scenario, and if employment-related figures hint at persistent weakness, the USD is likely to end the year on the back foot.
XAU/USD technical outlook
In the weekly chart, XAU/USD trades near its recent high and has room to extend its advance. The 20-week Simple Moving Average (SMA) heads north almost vertically, well below the current level, while above the 100- and 200-week SMAs, underscoring a robust bullish trend. Price holds well above its key averages, and the 20-week SMA at $3,838.86 offers critical dynamic support. At the same time, the Momentum indicator remains above its midline but lost its upward strength, reflecting a modest loss of speed after recent gains. Finally, the Relative Strength Index (RSI) stands at 75, yet without suggesting upward exhaustion. The bullish bias could suffer if the pair returns to levels below $4,250, yet for the most part, the pair is likely to retest record highs.
Taking a look at the daily chart, XAU/USD is bullish, yet likely to enter a consolidative stage. The 20-day SMA climbs above the 100- and 200-day SMAs as all three trend higher, underscoring a firm bullish bias. The shorter SMA provides dynamic support at around $4,172. Technical indicators have reached overbought territory and partially lost their upward strength, hinting at a potential corrective decline in the upcoming sessions. Still, the broader uptrend prevails, with speculative interest likely to push the bright metal towards the $4,380 region and beyond.
(The technical analysis of this story was written with the help of an AI tool)
Economic Indicator
Consumer Price Index ex Food & Energy (YoY)
Inflationary or deflationary tendencies are measured by periodically summing the prices of a basket of representative goods and services and presenting the data as the Consumer Price Index (CPI). CPI data is compiled on a monthly basis and released by the US Department of Labor Statistics. The YoY reading compares the prices of goods in the reference month to the same month a year earlier. The CPI Ex Food & Energy excludes the so-called more volatile food and energy components to give a more accurate measurement of price pressures. Generally speaking, a high reading is bullish for the US Dollar (USD), while a low reading is seen as bearish.
Read more.Next release: Thu Dec 18, 2025 13:30
Frequency: Monthly
Consensus: -
Previous: 3%
Source: US Bureau of Labor Statistics
The US Federal Reserve has a dual mandate of maintaining price stability and maximum employment. According to such mandate, inflation should be at around 2% YoY and has become the weakest pillar of the central bank’s directive ever since the world suffered a pandemic, which extends to these days. Price pressures keep rising amid supply-chain issues and bottlenecks, with the Consumer Price Index (CPI) hanging at multi-decade highs. The Fed has already taken measures to tame inflation and is expected to maintain an aggressive stance in the foreseeable future.
Employment FAQs
Labor market conditions are a key element to assess the health of an economy and thus a key driver for currency valuation. High employment, or low unemployment, has positive implications for consumer spending and thus economic growth, boosting the value of the local currency. Moreover, a very tight labor market – a situation in which there is a shortage of workers to fill open positions – can also have implications on inflation levels and thus monetary policy as low labor supply and high demand leads to higher wages.
The pace at which salaries are growing in an economy is key for policymakers. High wage growth means that households have more money to spend, usually leading to price increases in consumer goods. In contrast to more volatile sources of inflation such as energy prices, wage growth is seen as a key component of underlying and persisting inflation as salary increases are unlikely to be undone. Central banks around the world pay close attention to wage growth data when deciding on monetary policy.
The weight that each central bank assigns to labor market conditions depends on its objectives. Some central banks explicitly have mandates related to the labor market beyond controlling inflation levels. The US Federal Reserve (Fed), for example, has the dual mandate of promoting maximum employment and stable prices. Meanwhile, the European Central Bank’s (ECB) sole mandate is to keep inflation under control. Still, and despite whatever mandates they have, labor market conditions are an important factor for policymakers given its significance as a gauge of the health of the economy and their direct relationship to inflation.
Author

Valeria Bednarik
FXStreet
Valeria Bednarik was born and lives in Buenos Aires, Argentina. Her passion for math and numbers pushed her into studying economics in her younger years.


