Gold, Chart of the Week: Bears eye a break of multi-decade uptrend near $1,676
- Gold is correcting higher, but following a brief spell in the key Fibos, bears could emerge.
- The gold price could find itself at the edge of the abyss near $1,676.

As per the prior analysis, Gold, Chart of the Week: Bulls could be about to make their move, but downside well defined, the gold price has been offering something for both the bulls and bears love the past week. However, last Friday's Nonfarm Payrolls report from the US session interrupted the downside with the Unemployment Rate coming in at 3.7% vs. 3.5% expected. Average Hourly Earnings also missed the mark at 0.3% month on month vs. 0.4% expected. Consequently, the US dollar edged back from a 20-year high.
Nevertheless, Fed funds futures were unchanged after the jobs report and are pricing about a 75% chance that the Fed hikes rates by 75 basis points this month, according to Refinitiv data. This could see a swift pause in the yellow metal's correction for the week ahead which could coincide with a break below a multi-decade uptrend in the yellow metal near $1,676.
Gold prior analysis
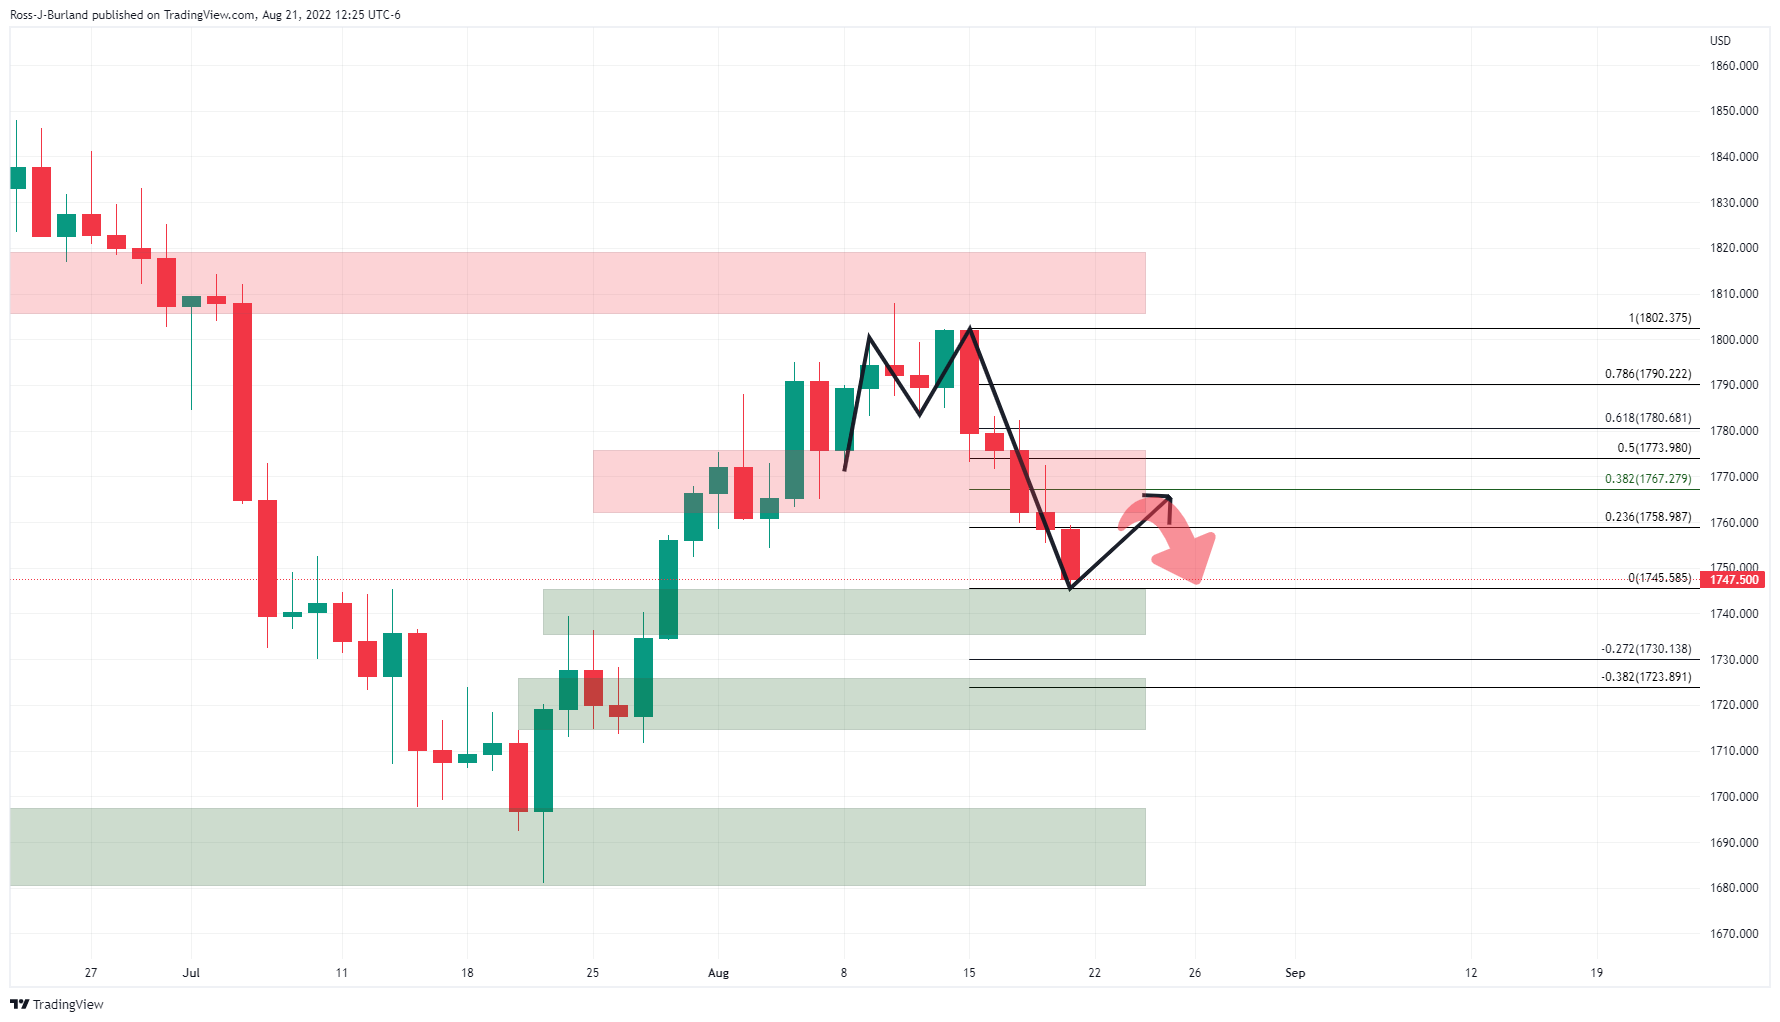
It was explained that the M-formation was a reversion pattern and it was expected to pull in the price, at least into the structure:
Gold, live updates
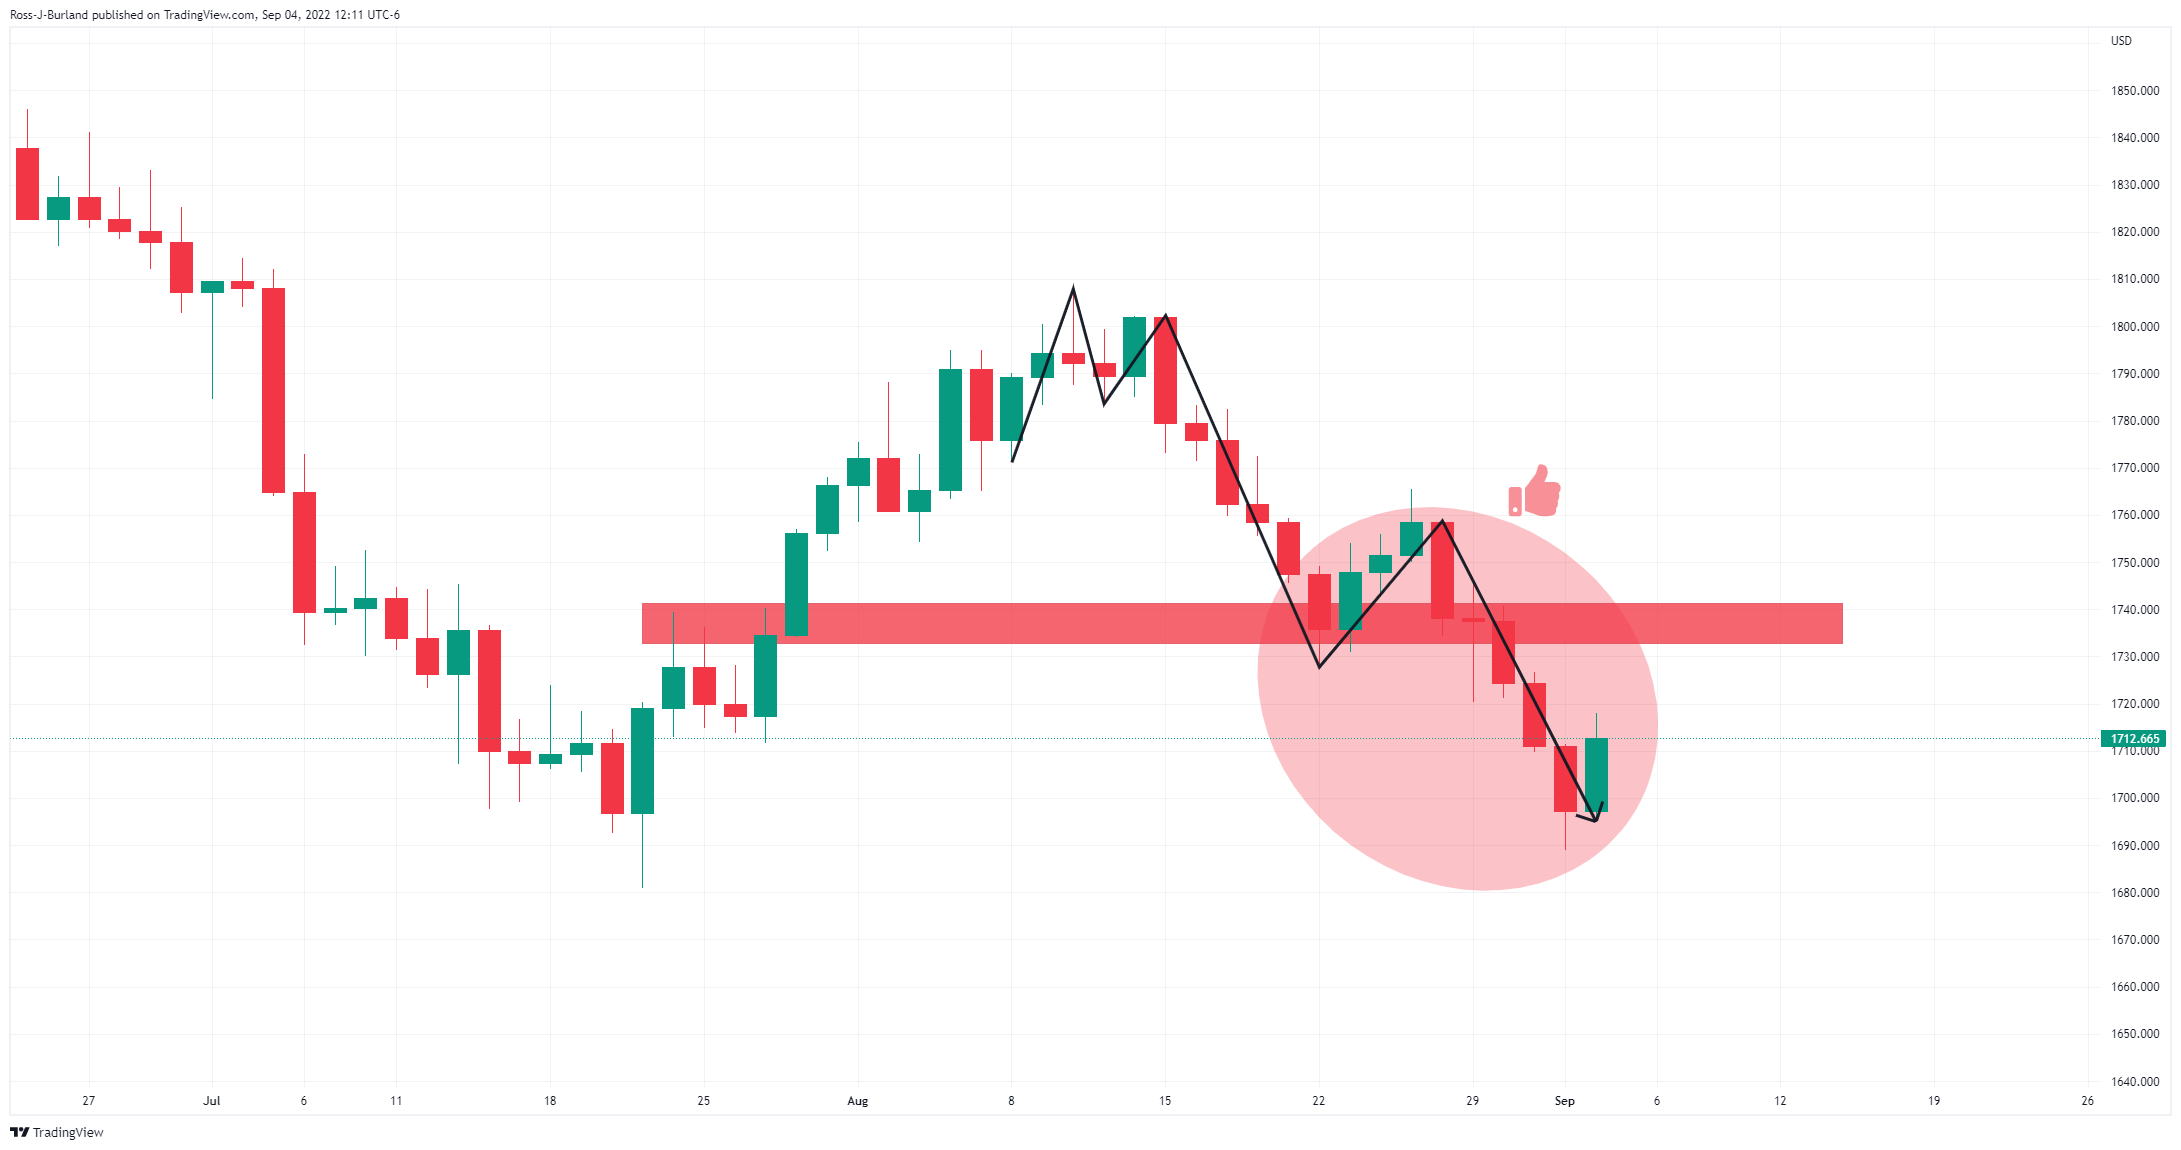
As shown, gold has followed the price trajectory to a tee.
The price has since corrected from a strong sell-off on the daily timeframe. The bulls were moving in on a 38.2% Fibonacci retracement on Friday and this leaves prospects for a deeper correction over the start of the week as illustrated on the chart below:
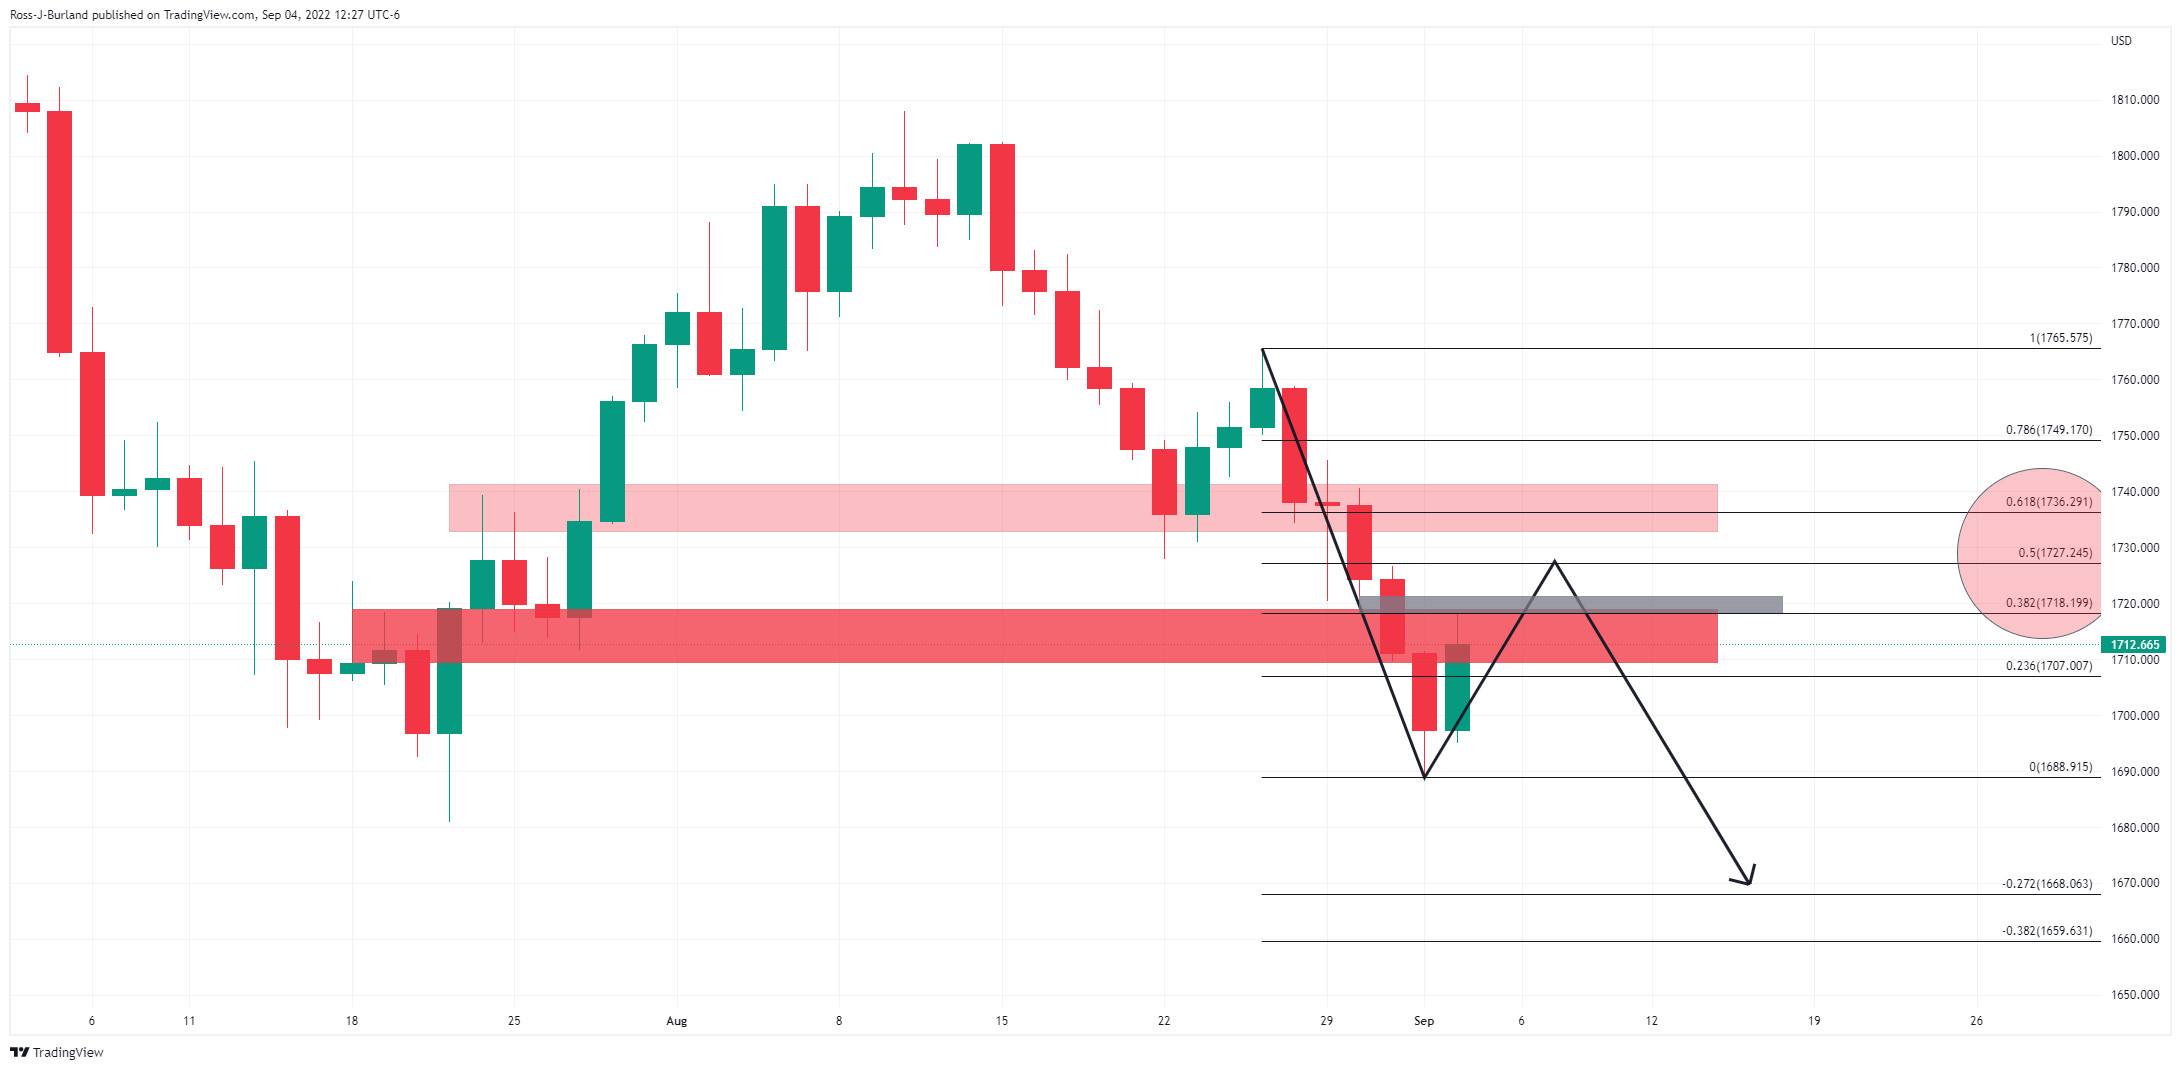
The price is headed towards a price imbalance near $1,721 and beyond there, a 50% mean reversion comes in near $1,727 prior structure. If bears give ground to the bulls there, then the last defence could be a touch higher around $1,736 as a 61.8% Fibonacci retracement.
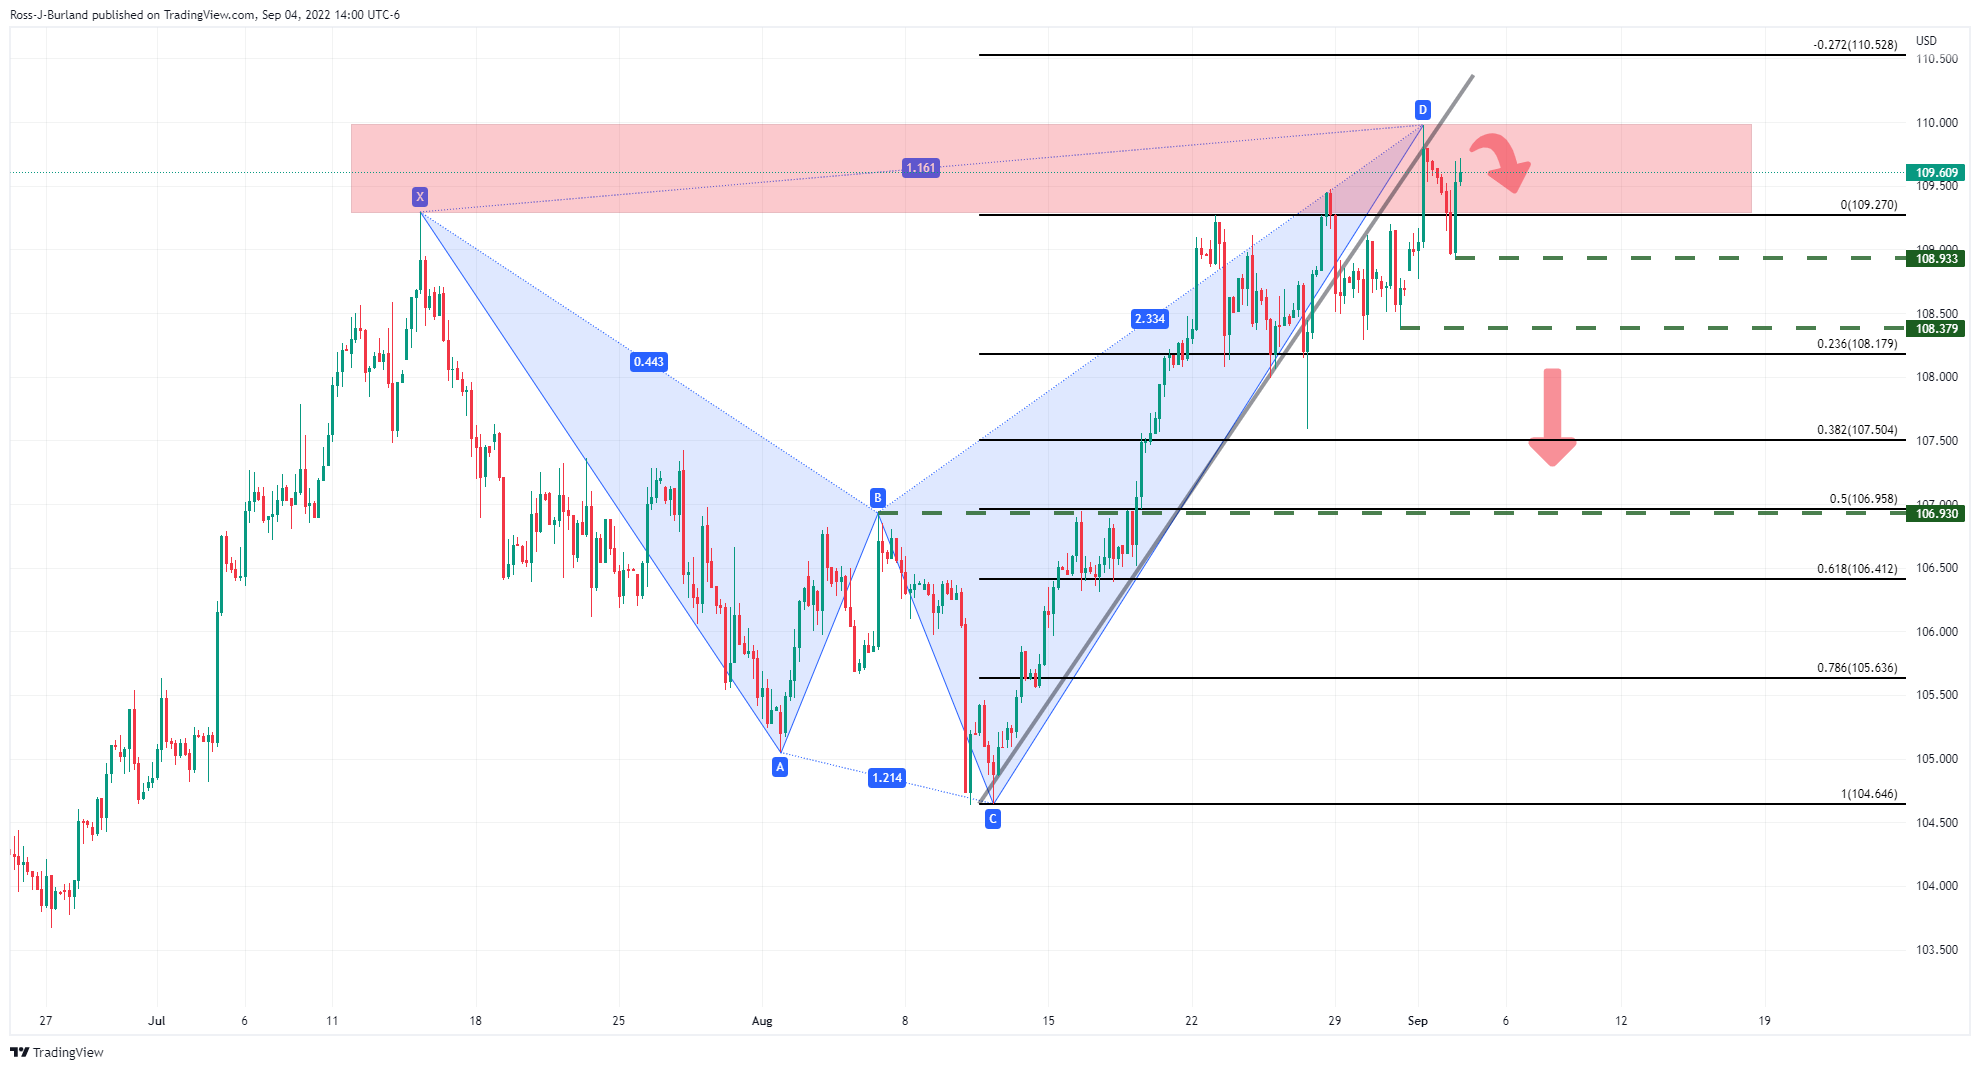
Gold H4 chart
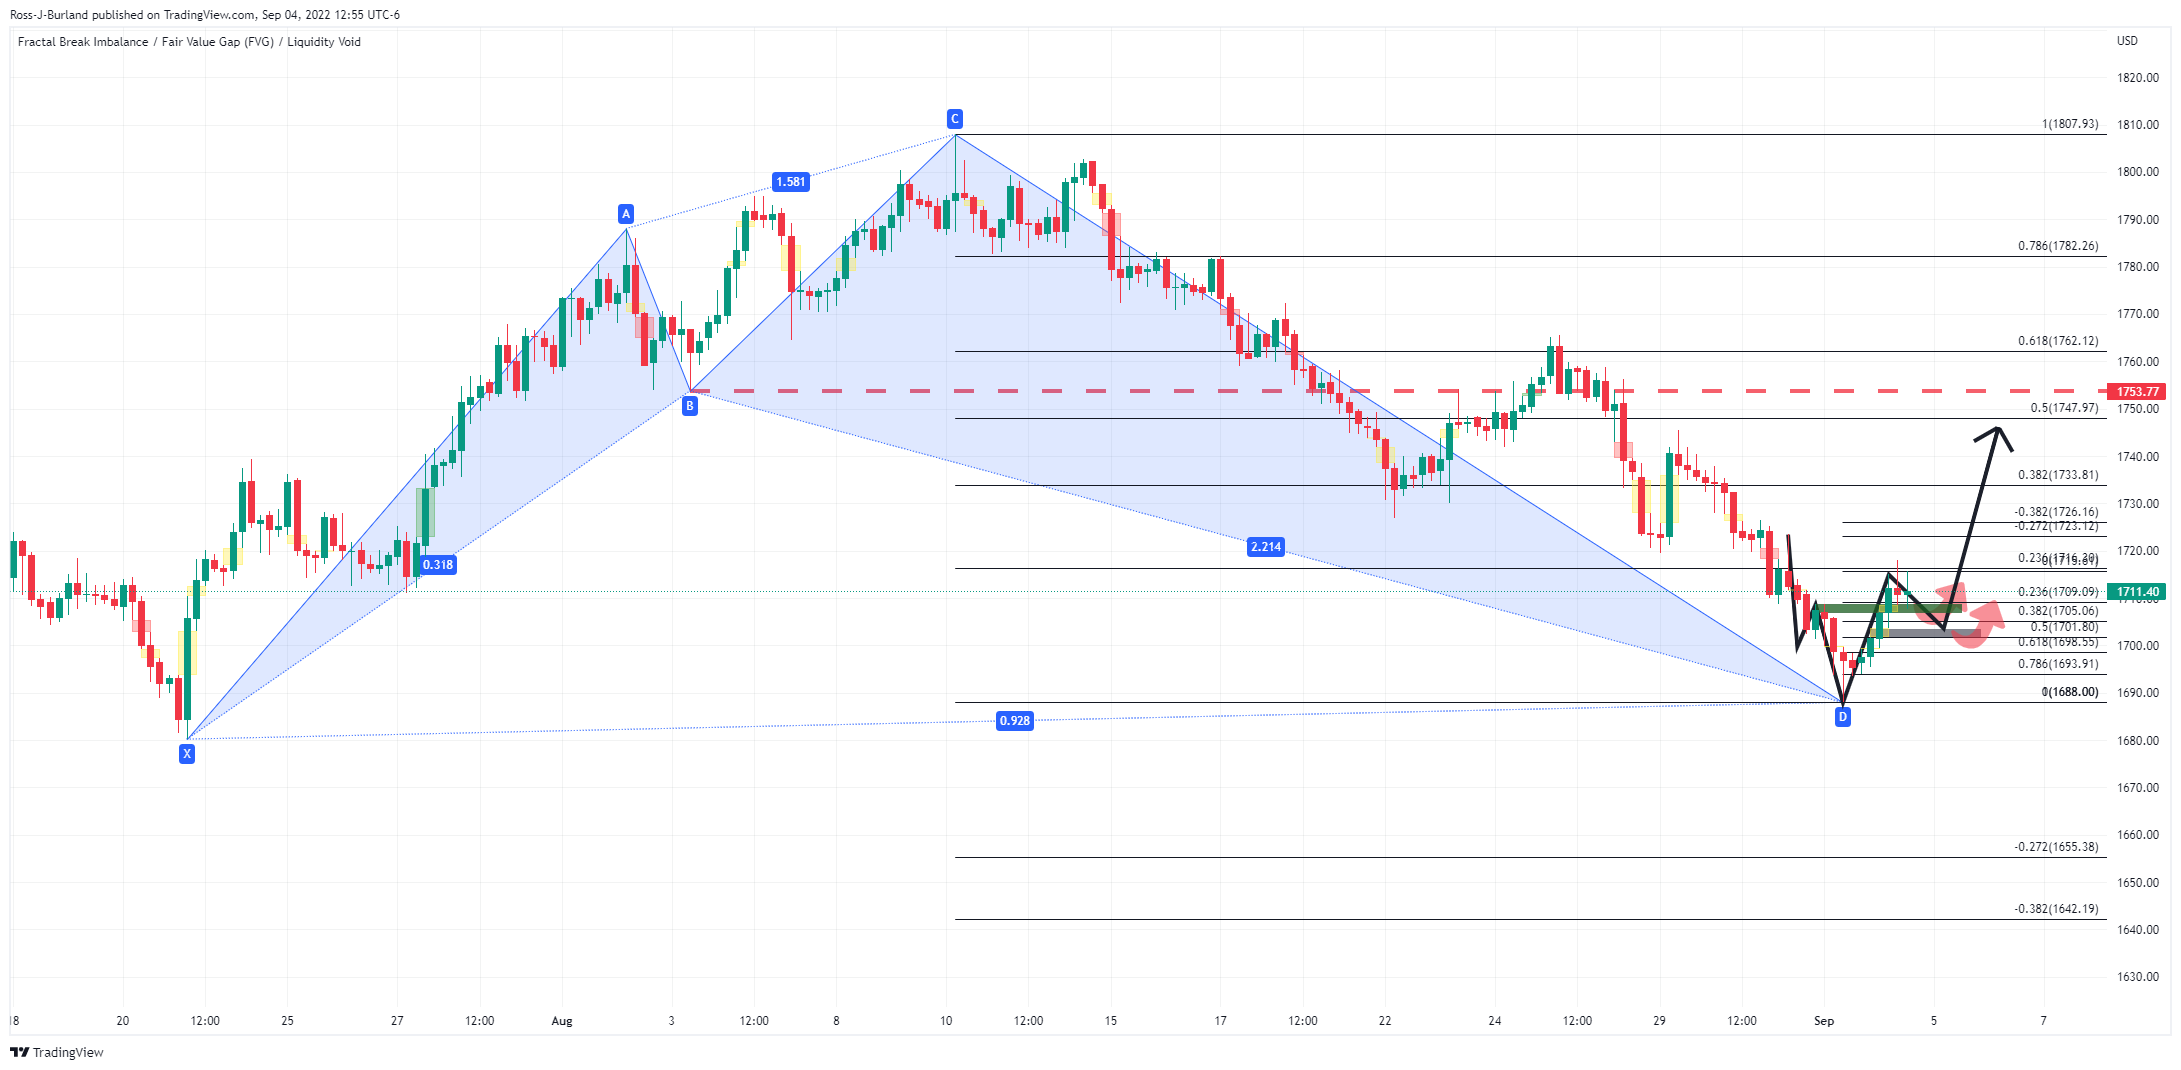
On the four-hour chart, the price is correcting the bullish run and a 50% mean reversion could offer support as it meets the neckline of the bullish M-formation. Also, the Shark harmonic pattern is in play which is a bullish confluence that leaves scope for a deeper correction towards the neckline near $1,750.
However, the extension of the downside remains probable for a retest of the 2021 lows around $1,676:

US dollar downside bias
The price is balanced around the 0.68 figure and should support hold, or even the 0.6775 level to the downside, then there are bullish prospects towards the mid-week highs on the way towards 0.6880/6900. The Shark on the following US dollar chart is also adding fuel to the bullish bias in gold and commodity currencies such as AUD.
Premium
You have reached your limit of 3 free articles for this month.
Start your subscription and get access to all our original articles.
Author

Ross J Burland
FXStreet
Ross J Burland, born in England, UK, is a sportsman at heart. He played Rugby and Judo for his county, Kent and the South East of England Rugby team.


