Gold, Chart of the Week: Bulls could be about to make their move, but downside well defined
- Gold's downtrend remains intact, but a meanwhile correction could be on the cards.
- Jackson Hole symposium Chair Jerome Powell's remarks could be defining this week.

Gold ended Friday by some 0.62%, breaking a critical support structure which reinforces the bearish bias across the daily chart as illustrated below. Fundamentally, all eyes will be on the Jackson Hole symposium where Chair Jerome Powell's remarks could be a key avenue for the Fed to push back against the notable easing in financial conditions sparked by his prior statements that led to the market pricing in the prospects of rate cuts immediately following the rate hiking cycle.
''As market expectations for rate cuts subside, speculative appetite in precious metals should dry up even further,'' analysts at TD Securities said who are anticipating a capitulation event in gold.
Gold, daily chart
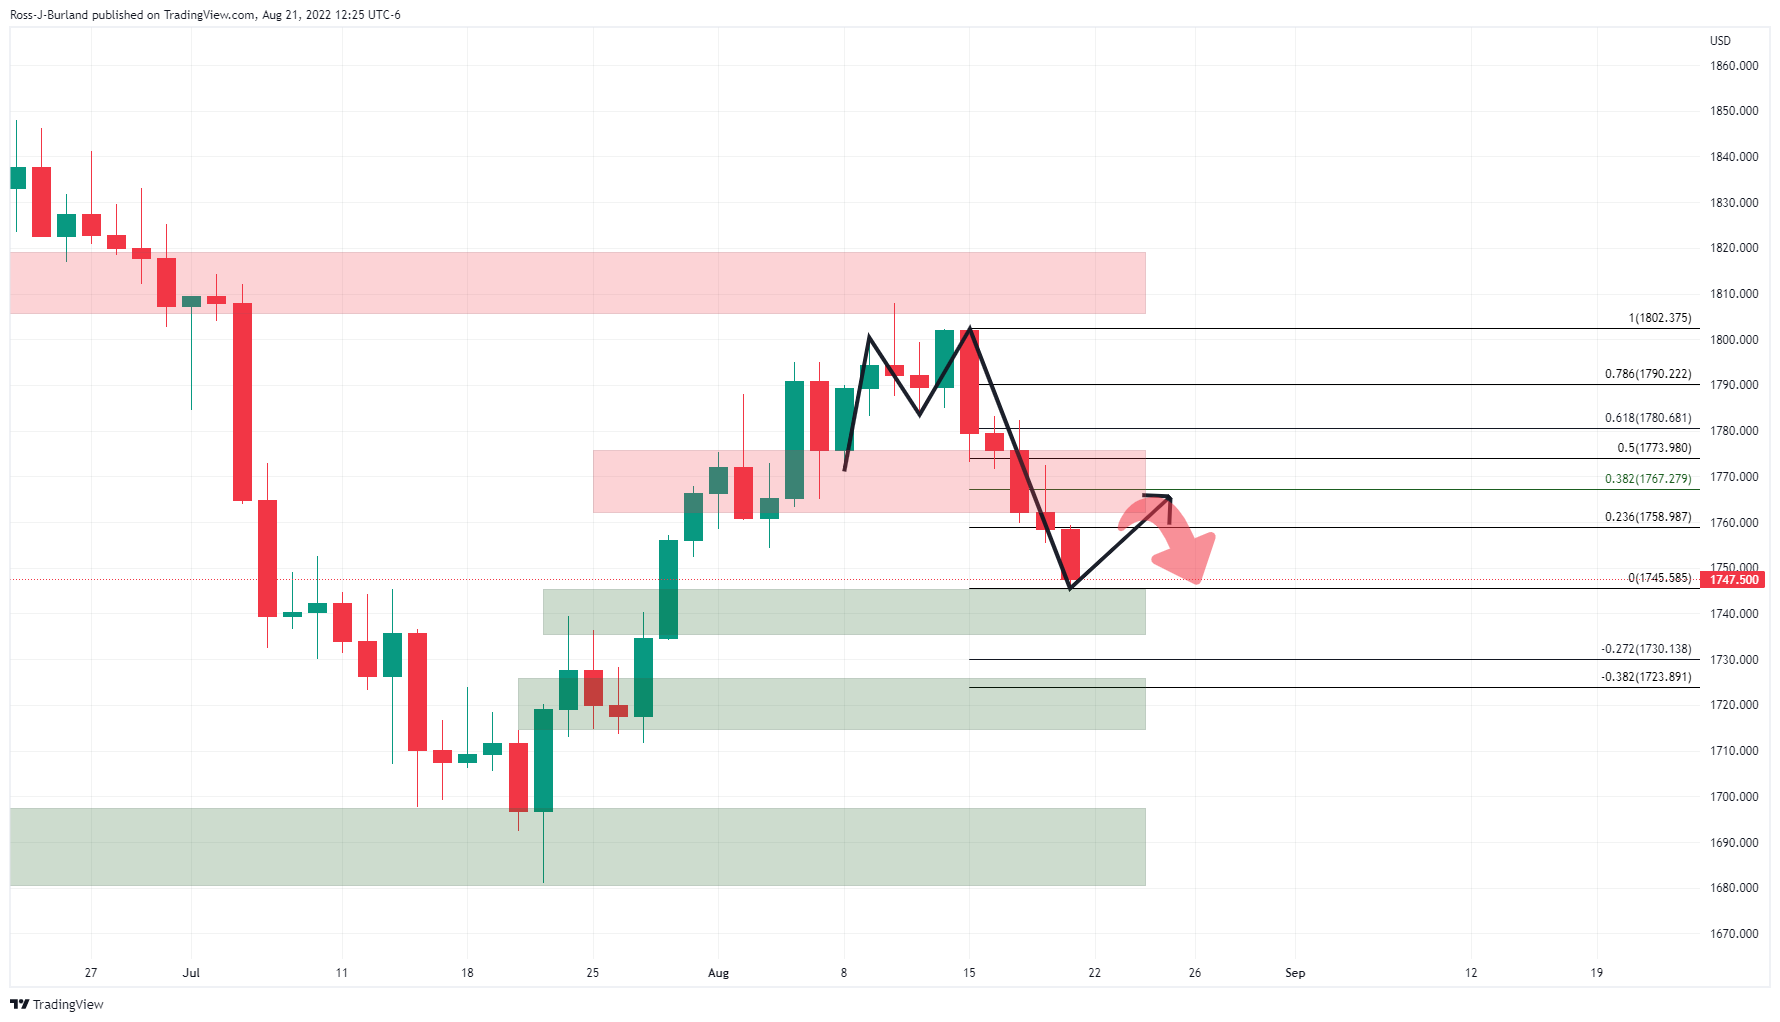
The support structures are based on a volume profile of the bull trend while the resistance in the 1760s has a confluence of the prior lows and structure and a 38.2% Fibonacci area. The M-formation is a reversion pattern that would be expected to pull in the price, at least into the structure at $1,754 and a touch through there in the opening days of the week. However, a downside continuation without a near-term correction will target the $1,720s.
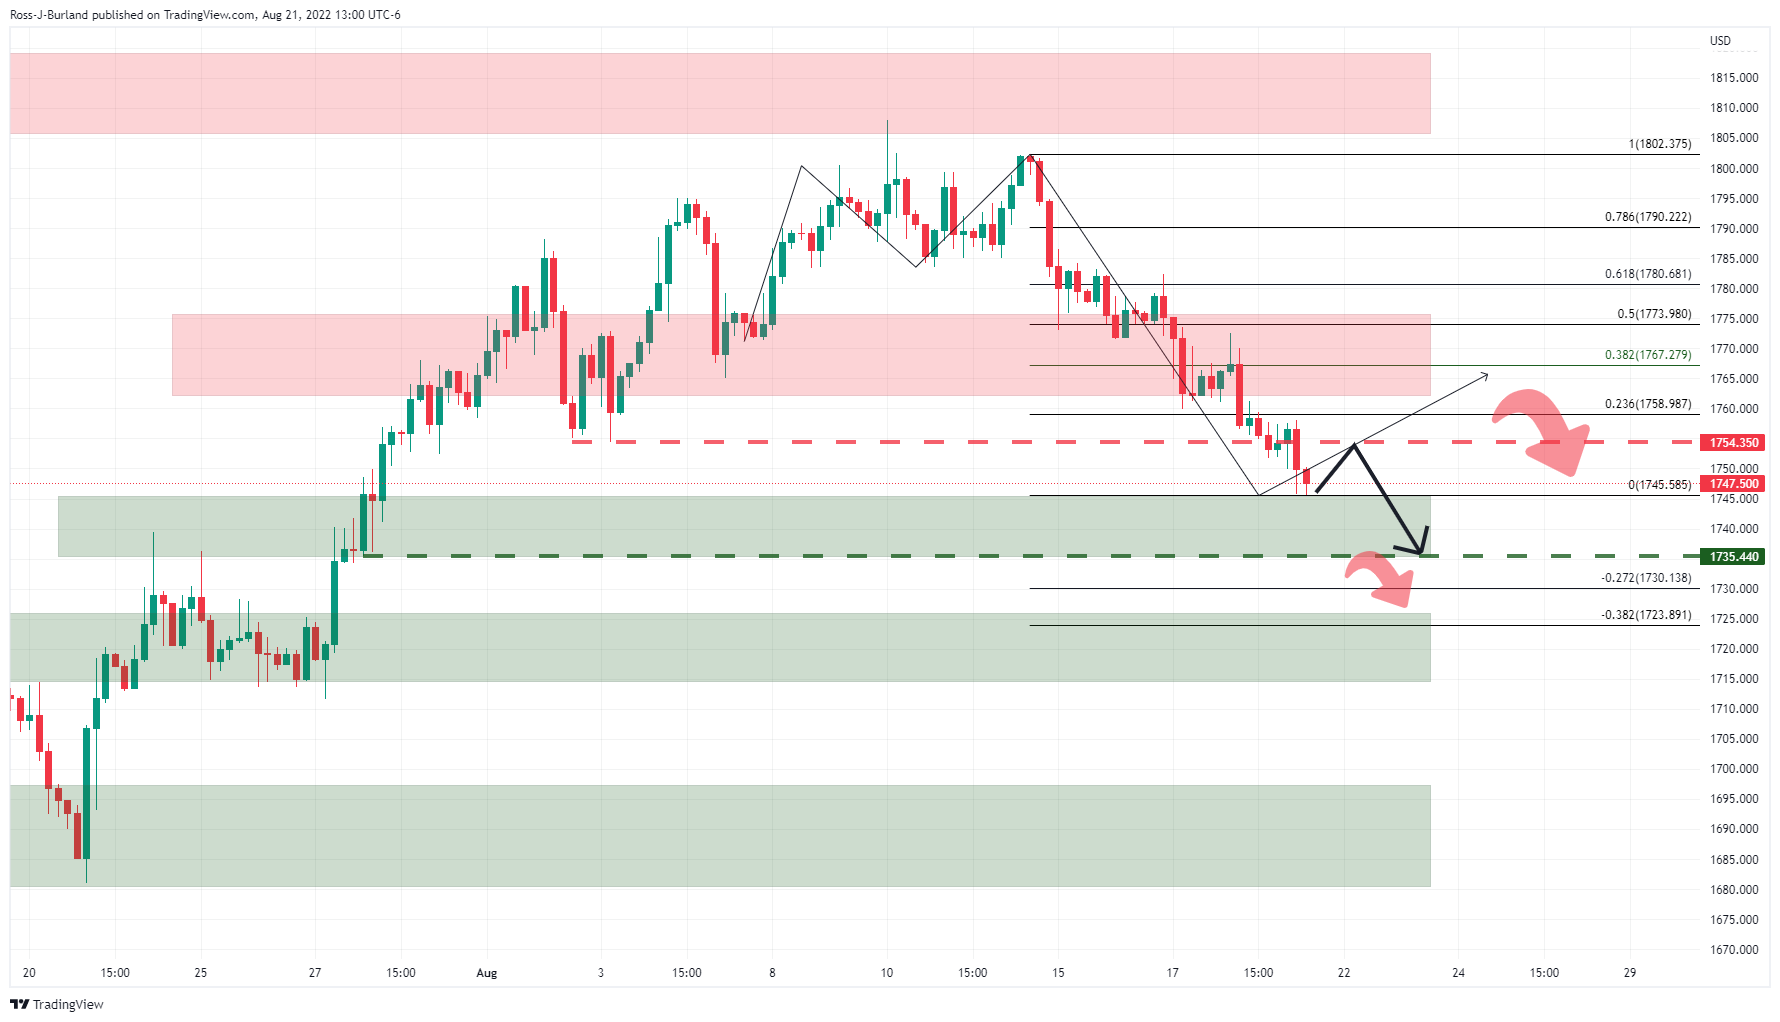
Gold, H4 chart
A break of 1735 will be key in the nearer term:
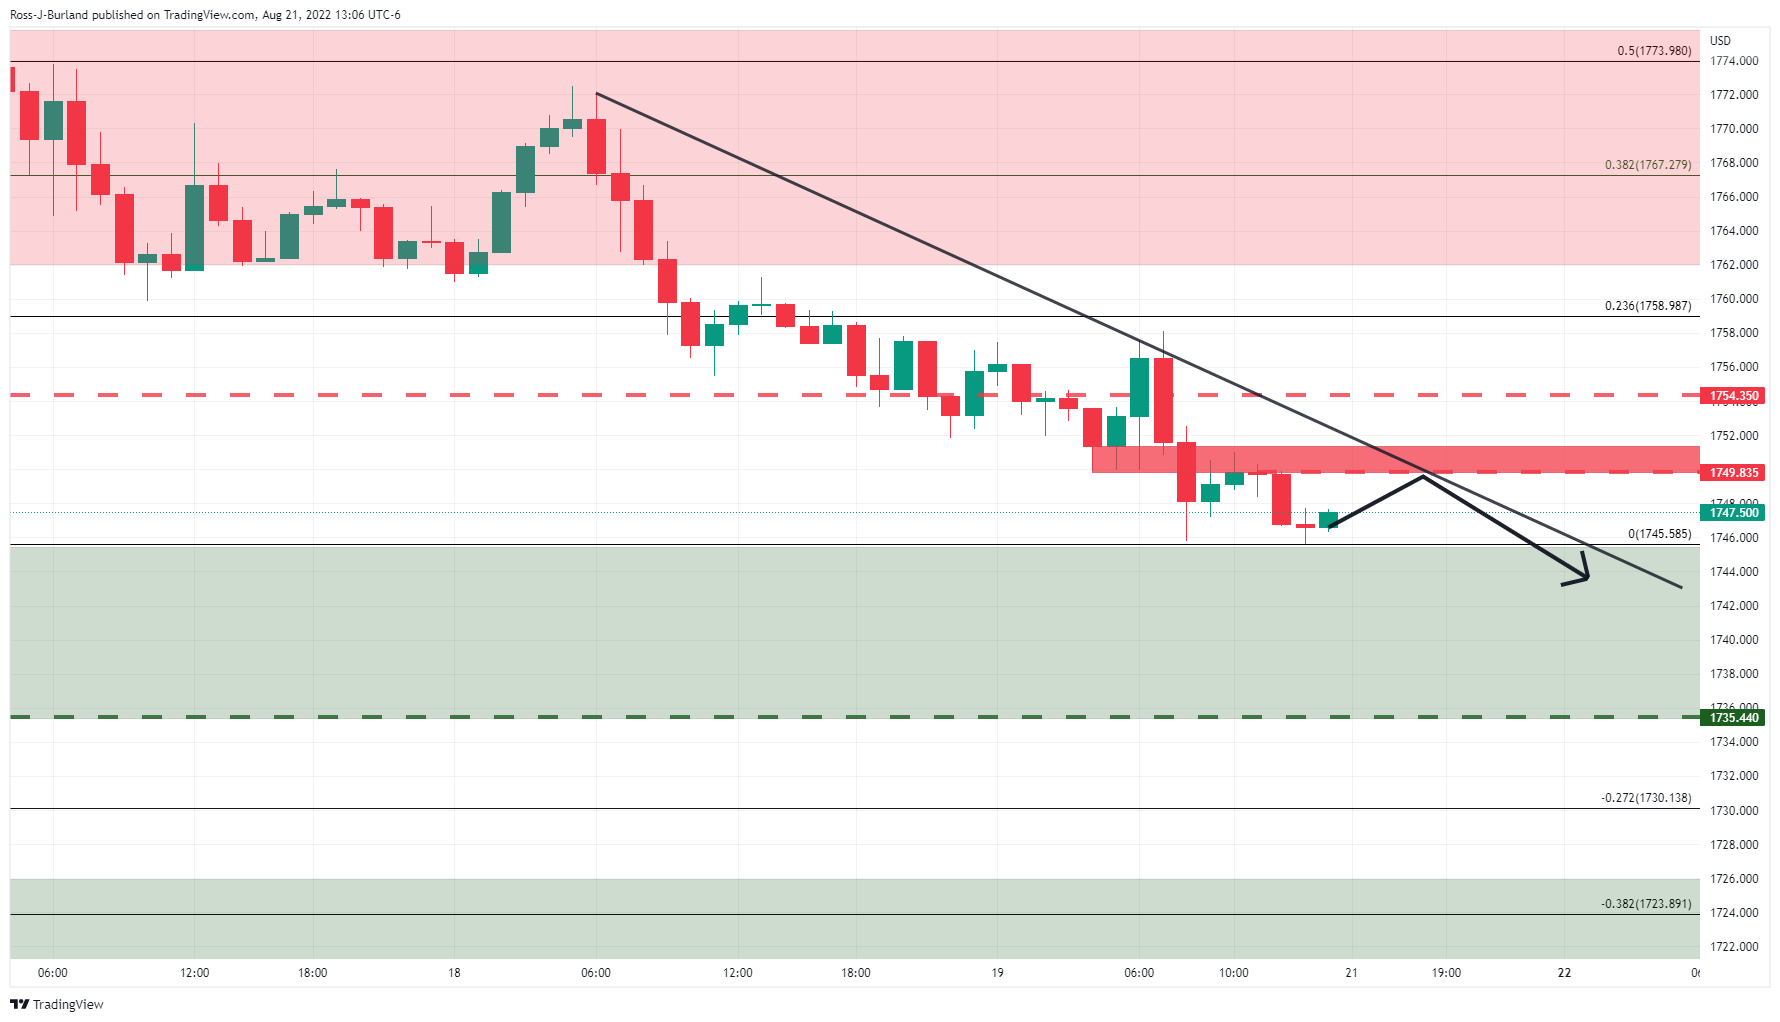
Gold H1 chart
For the open, the trendline resistance and closing highs of 1750 will be a key feature guarding the upside on the hourly chart.
Premium
You have reached your limit of 3 free articles for this month.
Start your subscription and get access to all our original articles.
Author

Ross J Burland
FXStreet
Ross J Burland, born in England, UK, is a sportsman at heart. He played Rugby and Judo for his county, Kent and the South East of England Rugby team.


