Gold-to-Silver ratio: Why it’s falling and what could come next

What the Gold-to-Silver ratio measures — and why it matters
The gold-to-silver ratio measures how many ounces of silver it takes to buy one ounce of gold. It’s a long-standing barometer of relative strength between the two precious metals — and by extension, a useful lens into macro risk sentiment.
When the ratio rises, it means gold is outperforming silver. That typically happens when investors grow more cautious, preferring the relative safety of gold over the higher-beta behavior of silver.
When the ratio falls, silver is outperforming gold, which tends to coincide with periods of improving growth expectations and stronger risk appetite across markets.
In other words, the ratio functions less as a mean-reversion trade and more as a regime indicator — a reflection of the market’s underlying tone between defensive and cyclical positioning.
Why the ratio has been falling
The recent collapse in the gold/silver ratio reflects a combination of macro tailwinds for silver and a broader rotation toward risk-on sentiment. Several overlapping drivers likely explain the move.
1. Improving growth and industrial cycle
Silver’s industrial component — spanning solar panels, electronics, and electric vehicles — makes it far more sensitive to the global manufacturing cycle than gold.
Recent signs of stabilization in China’s PMIs and improving industrial sentiment in Europe and the U.S. have likely encouraged investors to reprice growth expectations higher.
As a result, silver has been the higher-beta beneficiary, while gold, though still firm, has lagged on a relative basis.
2. Better liquidity and risk appetite
Throughout late 2025, markets have shown evidence of easing liquidity stress and narrowing credit spreads, signaling improved funding conditions.
When investors grow more comfortable with liquidity, they tend to rotate out of defensive assets like gold and into higher-beta plays such as silver.
This dynamic has historically been one of the most consistent contributors to a falling gold/silver ratio.
3. Shifts in real yields and Fed expectations
Real yields — the inflation-adjusted return on U.S. Treasuries — have moderated in recent months as Fed policy expectations have turned less restrictive.
Since both metals are non-yielding, falling real yields tend to be supportive. But silver, with its cyclical profile, often reacts more positively to the perception that policy is shifting toward growth support.
This has given silver additional tailwinds during the ratio’s recent leg lower.
4. A softer U.S. Dollar
A weaker USD typically supports both gold and silver, but silver tends to respond more strongly. The dollar’s drift lower into late 2025, partly on softer U.S. data and policy repricing, has amplified silver’s outperformance and driven the ratio sharply lower.
5. Silver positioning and volatility
Silver’s volatility cuts both ways. Earlier in the year, speculative short covering and fresh long exposure added fuel to the upside, compressing the ratio rapidly.
While this move may have overshot in the short term, it underscores the leverage and momentum sensitivity inherent in silver — traits that make the ratio both powerful and risky as a signal.
What could make the ratio turn higher again
The recent collapse has taken the ratio deep into oversold territory. While there’s room for continued silver outperformance, several macro catalysts could trigger a turn higher over the next 2–8 weeks:
1. China or Global PMIs rolling over
If the recent stabilisation in global manufacturing fades — especially if China’s PMIs weaken again — silver’s industrial leverage could turn from tailwind to headwind.
A growth scare or renewed slowdown would likely push investors back toward gold, lifting the ratio.
2. A risk-off flare-up
Any widening in credit spreads, renewed funding stress, or spike in volatility indices (e.g., VIX) could flip market tone to defensive.
In that environment, gold historically outperforms, and the gold/silver ratio tends to rise sharply.
3. USD or real yield bounce
If the USD stages a recovery — perhaps due to a hawkish Fed repricing or stronger inflation data lifting real yields — both metals could come under pressure.
Silver, being the higher-beta asset, would likely fall faster, causing the ratio to rebound.
4. Silver positioning unwind
Speculative longs in silver futures have grown crowded after the recent rally.
A volatility-driven shakeout or profit-taking episode could see silver drop quickly, even if gold remains relatively stable — a classic driver of a short-term ratio bounce.
What it would likely mean for Gold and Silver prices
If the ratio continues to fall
A continued decline would reinforce the pro-cyclical narrative: silver outperforming as investors lean into industrial and risk-sensitive assets.
Gold could still rise in absolute terms — particularly if real yields remain contained — but its relative performancewould likely remain muted.
If the ratio turns higher
A rebound would signal a shift back toward defensiveness.
That scenario often sees gold holding up better, benefiting from safe-haven flows and macro caution, while silver lags or consolidates due to its higher beta and cyclical exposure.
What I’m watching
- Global and China PMIs — leading indicators of industrial momentum.
- Credit spreads — early warnings of funding or liquidity stress.
- Real yields (TIPS market) — key input for non-yielding asset demand.
- USD index (DXY) — the macro tide for metals.
- Fed repricing via futures — policy tone drives yield differentials.
- Silver volatility (Cboe SILVIX) — watch for spikes signaling shakeouts.
- ETF inflows/outflows — retail and institutional sentiment gauge.
- Technical boundaries — weekly channel limits and RSI extremes.
Technicals
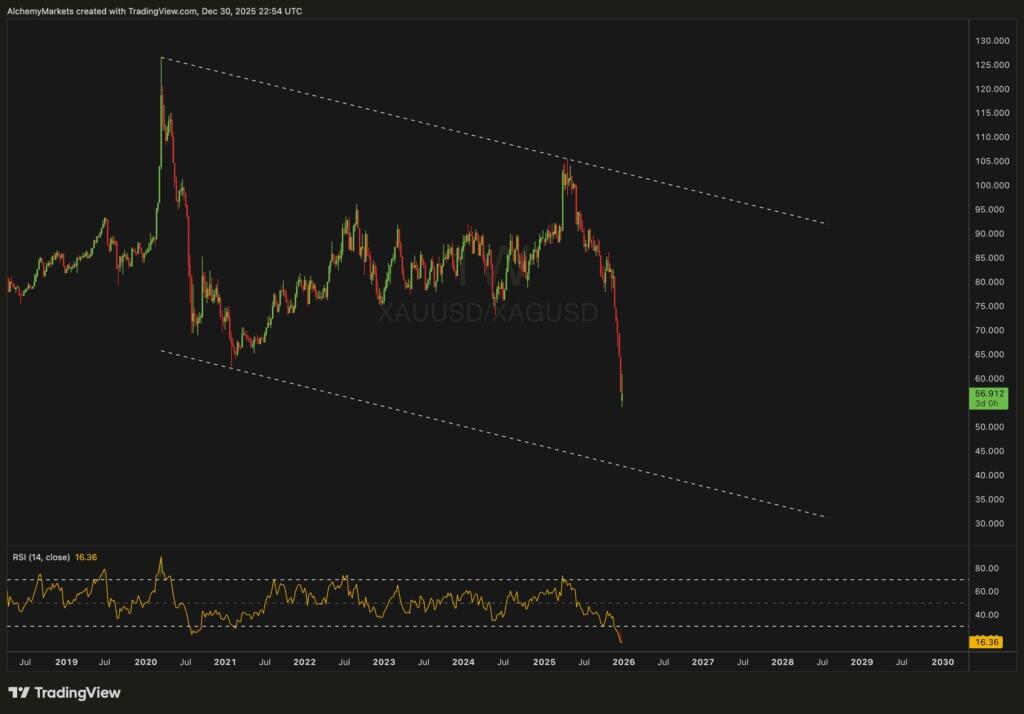
The weekly chart shows the gold/silver ratio still trending lower within a well-defined descending channel.
There remains some room to the downside, potentially carrying into the next quarter as the ratio approaches the lower bound of that channel.
However, the RSI is deeply oversold (currently near 16), suggesting momentum may begin to flatten or turn choppy.
This setup supports the idea of volatile, two-way trading — continued downside in the short term but with rising risks of a technical rebound once exhaustion sets in.
Bottom line
The gold/silver ratio isn’t just a metals chart — it’s a macro thermometer.
Its sharp decline reflects a market tilting away from defensiveness toward cyclical optimism.
But with positioning stretched and sentiment bullish on silver, the setup looks increasingly asymmetric: further downside is possible, yet the probability of a rebound is building as macro and technical conditions converge.
Author

Zorrays Junaid
Alchemy Markets
Zorrays Junaid has extensive combined experience in the financial markets as a portfolio manager and trading coach. More recently, he is an Analyst with Alchemy Markets, and has contributed to DailyFX and Elliott Wave Forecast in the past.


