Gold Price Forecast: Coronavirus, Oil War and King Dollar
- The oil war between Saudi Arabia and Russia took its toll on the bright metal.
- Gold prices ending the week with losses despite risk-off dominated the headlines.
- Spot gold recovered on Friday but held below the 38.2% retracement of the weekly slide.

For sure, the last trading week will make a chapter in the history of financial markets. The coronavirus-triggered crisis escalated exponentially starting Sunday, triggering gaps throughout the board. Spot gold advanced up to $1,703.18 a troy ounce, its highest since December 2012. The bright metal, however, was unable to extend its rally, and in fact, plummeted despite panic ruled.
Coronavirus and the oil crisis led the way
Wall Street collapsed, with US indexes having their worst day in over three decades on Thursday, yet gold maintaining the negative rout, despite other safe-haven assets appreciated. Demand for the greenback partially curbed the metal’s appeal but also plummeting oil prices.
The OPEC+ meeting that took place in Vienna late last week ended with Saudi Arabia declaring war to Russia. Saudi Arabia proposed a cut of 1.5 million barrels per day, something that Russia rejected pushing the first to take revenge: the kingdom’s largest producer, Aramco, slashed oil prices and pledged to increase output by 2 million barrels per day. The barrel’s price collapsed, with WTI trading as low as $27.28 a barrel, losing roughly 25%. Despite a late recovery, the black gold is set to end its worst week in twelve years.
King Dollar limiting gold’s recovery
Spot recovered late Thursday and retain the positive tone heading into the weekend, helped by extreme measures taken by the US Central Bank. It was the New York Federal Reserve that pumped massive liquidity into the financial system, announcing a $500B repo operation and announcing plans to pump at least $1.5 trillion. Also, the Federal Reserve compromised to start buying Treasuries. The news fueled demand for the greenback, keeping gold’s recovery in check. Spot heads into the weekly close quoting at around $1,582.00 a troy ounce, off a multi-week low of 1,551.27.
Dollar remains king amid continued demand for US government bonds, but next week, the US Federal Reserve is having a monetary policy meeting. The central bank may well announce additional measures to fight the possible economic collapse and spook investors away from the greenback, leading to a recovery of the safe-haven metal.
Spot Gold Technical Outlook
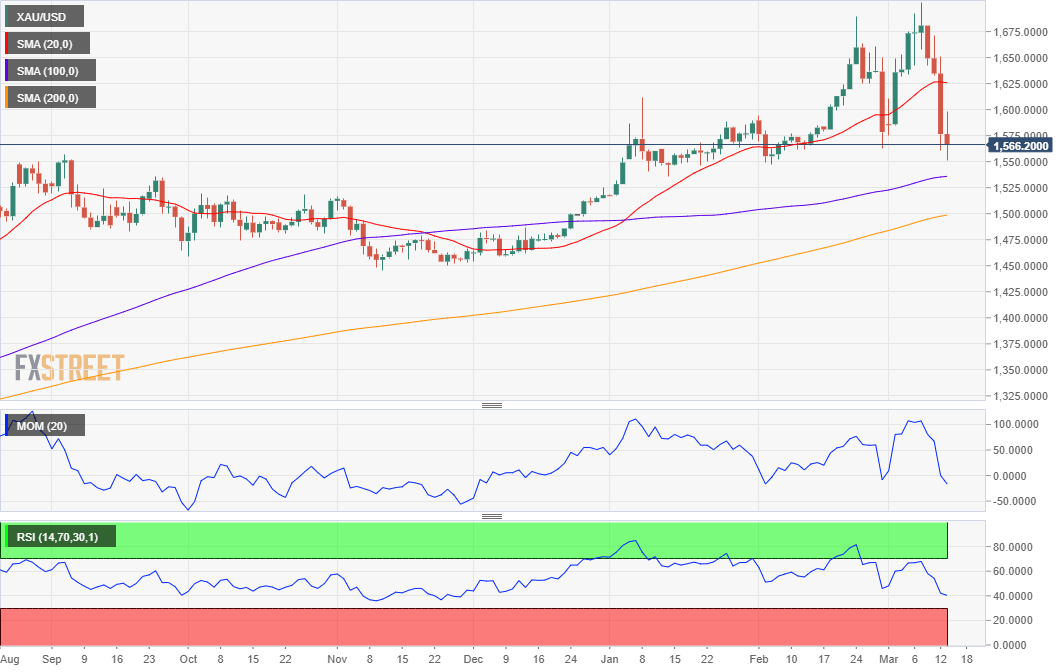
Spot gold is trading below a critical area ahead of the close, as it lost the battle with a long-term major Fibonacci level, the 61.8% retracement of the 2011/2015 decline, and also the 23.6% retracement of its weekly decline, both levels just shy of 1,590.00.
The weekly chart shows that technical indicators are retreating sharply from overbought levels, maintaining their bearish slopes although well above their midlines. Also, the 20 SMA has lost its bullish strength but stands below the weekly low at 1,538.26. The 100 and 200 SMA continue heading north with moderated strength well below the current level. That said, the risk of a steeper decline seems limited in the long-term.
The daily chart shows that technical indicators have stalled their sharp declines near oversold levels, while the price develops some $50 below a now flat 20 DMA, indicating that the commodity may well resume its decline, particularly if it remains incapable of stabilizing above the current price zone. The larger moving averages continue to head higher below the current level, although losing their strength upward.
Gold Sentiment Poll
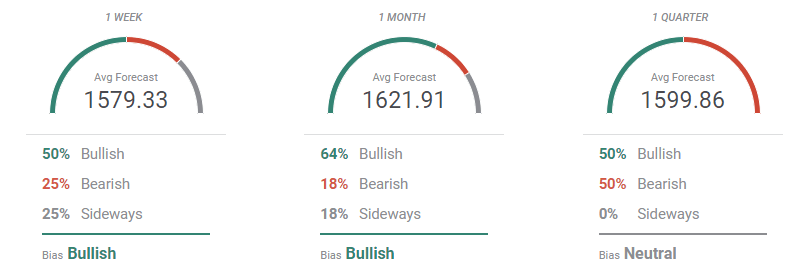
The FXStreet Forecast Poll shows that given that fear persists, buyers are still a majority. The bright metal is seen rising in the weekly and monthly perspective while hovering around 1,600, mostly neutral in the quarterly view. Bears account for 25% in the weekly view, and just 18% in the monthly perspective. Despite the latest slide, it seems that speculative interest is not yet ready to give up on gold longs.
The Overview chart, however, tells a different story. The moving averages have turned sharply lower in all the time frames under study, and while there’s a wide range of targets, most accumulate below the current price in the weekly and monthly perspectives.
Related Forecasts:
GBP/USD Forecast: Can the UK's leadership advantage dethrone King Dollar? Coronavirus, Fed eyed
Author

Valeria Bednarik
FXStreet
Valeria Bednarik was born and lives in Buenos Aires, Argentina. Her passion for math and numbers pushed her into studying economics in her younger years.


