EUR/USD Price Forecast: Decent support comes at 1.1030
- EUR/USD added to Friday’s retracement and revisited the 1.1030 zone.
- The Greenback maintained its bullish momentum ahead of US CPI data.
- Investors expect the ECB to lower its policy rate by 25 bps on Thursday.

EUR/USD gained fresh downward momentum on Monday, extending its losses from Friday and revisiting the 1.1030 region, driven by sustained buying pressure on the US Dollar (USD).
Meanwhile, the US Dollar Index (DXY) continued to climb, building on its strong post-NFP rebound and testing the 101.70 level as investors adjusted to the mixed US labour market data, dampening expectations of a 50 bps rate cut by the Fed later this month.
Investors are closely monitoring signals about the scale of the Fed's anticipated rate cut this month, especially after Fed Chair Jerome Powell indicated at the Jackson Hole Symposium that it might be time to adjust monetary policy. He noted that, barring any unexpected events, the labour market is unlikely to significantly contribute to inflationary pressures soon, and emphasized the Fed's reluctance to see further cooling in labour market conditions.
Recent comments from some Fed officials (San Francisco Fed President Mary Daly, New York fed President John Williams, Chicago Fed President Austan Goolsbee) were also inclined to start the easing cycle at the September 18 gathering.
In this context, the upcoming US Consumer Price Index (CPI) report is set to be a critical factor, especially given the Fed's shift from a sole focus on controlling inflation to preventing job losses.
According to the CME Group's FedWatch Tool, there is currently around a 73% probability of a 25 bps rate cut in September, up from nearly 70% during last week.
Meanwhile, the European Central Bank's (ECB) recent minutes revealed that policymakers did not see a compelling reason to cut interest rates last month. However, they indicated that this decision could be revisited in September due to the impact of high rates on economic growth.
Recent reports suggest growing divisions among ECB policymakers regarding the growth outlook, which could affect future discussions on rate cuts. Some officials are worried about a possible recession, while others are focused on persistent inflationary pressures.
Nonetheless, lower-than-expected flash CPI data for August in Germany and the Eurozone could challenge the cautious stance of some officials, potentially opening the door for the ECB to consider another rate cut at its September 12 meeting.
Overall, if the Fed moves forward with additional or larger rate cuts, the policy gap between the Fed and the ECB could narrow over the medium to long term, potentially benefiting EUR/USD. This is particularly likely as markets expect two more rate cuts from the ECB this year.
However, in the longer term, the US economy is expected to outperform the European economy, which could limit any sustained weakness in the dollar.
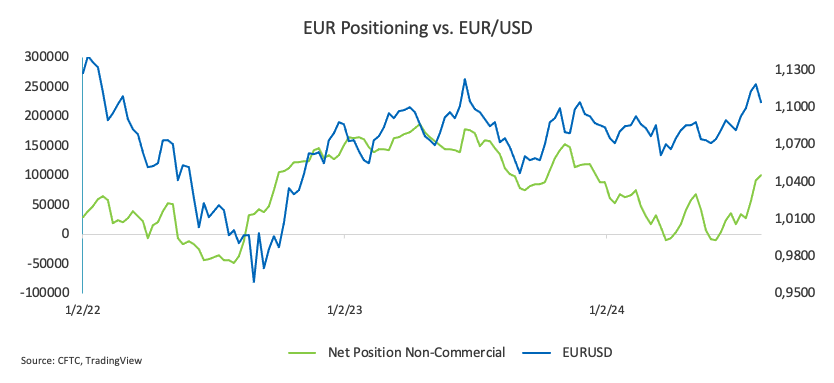
Lastly, speculators (non-commercial traders) have increased their net long positions in the Euro (EUR) to levels not seen since January, while commercial traders (such as hedge funds) have raised their net short positions to multi-month highs, all against the backdrop of a marked increase in open interest, according to the CFTC report for the week ending September 3.
EUR/USD daily chart
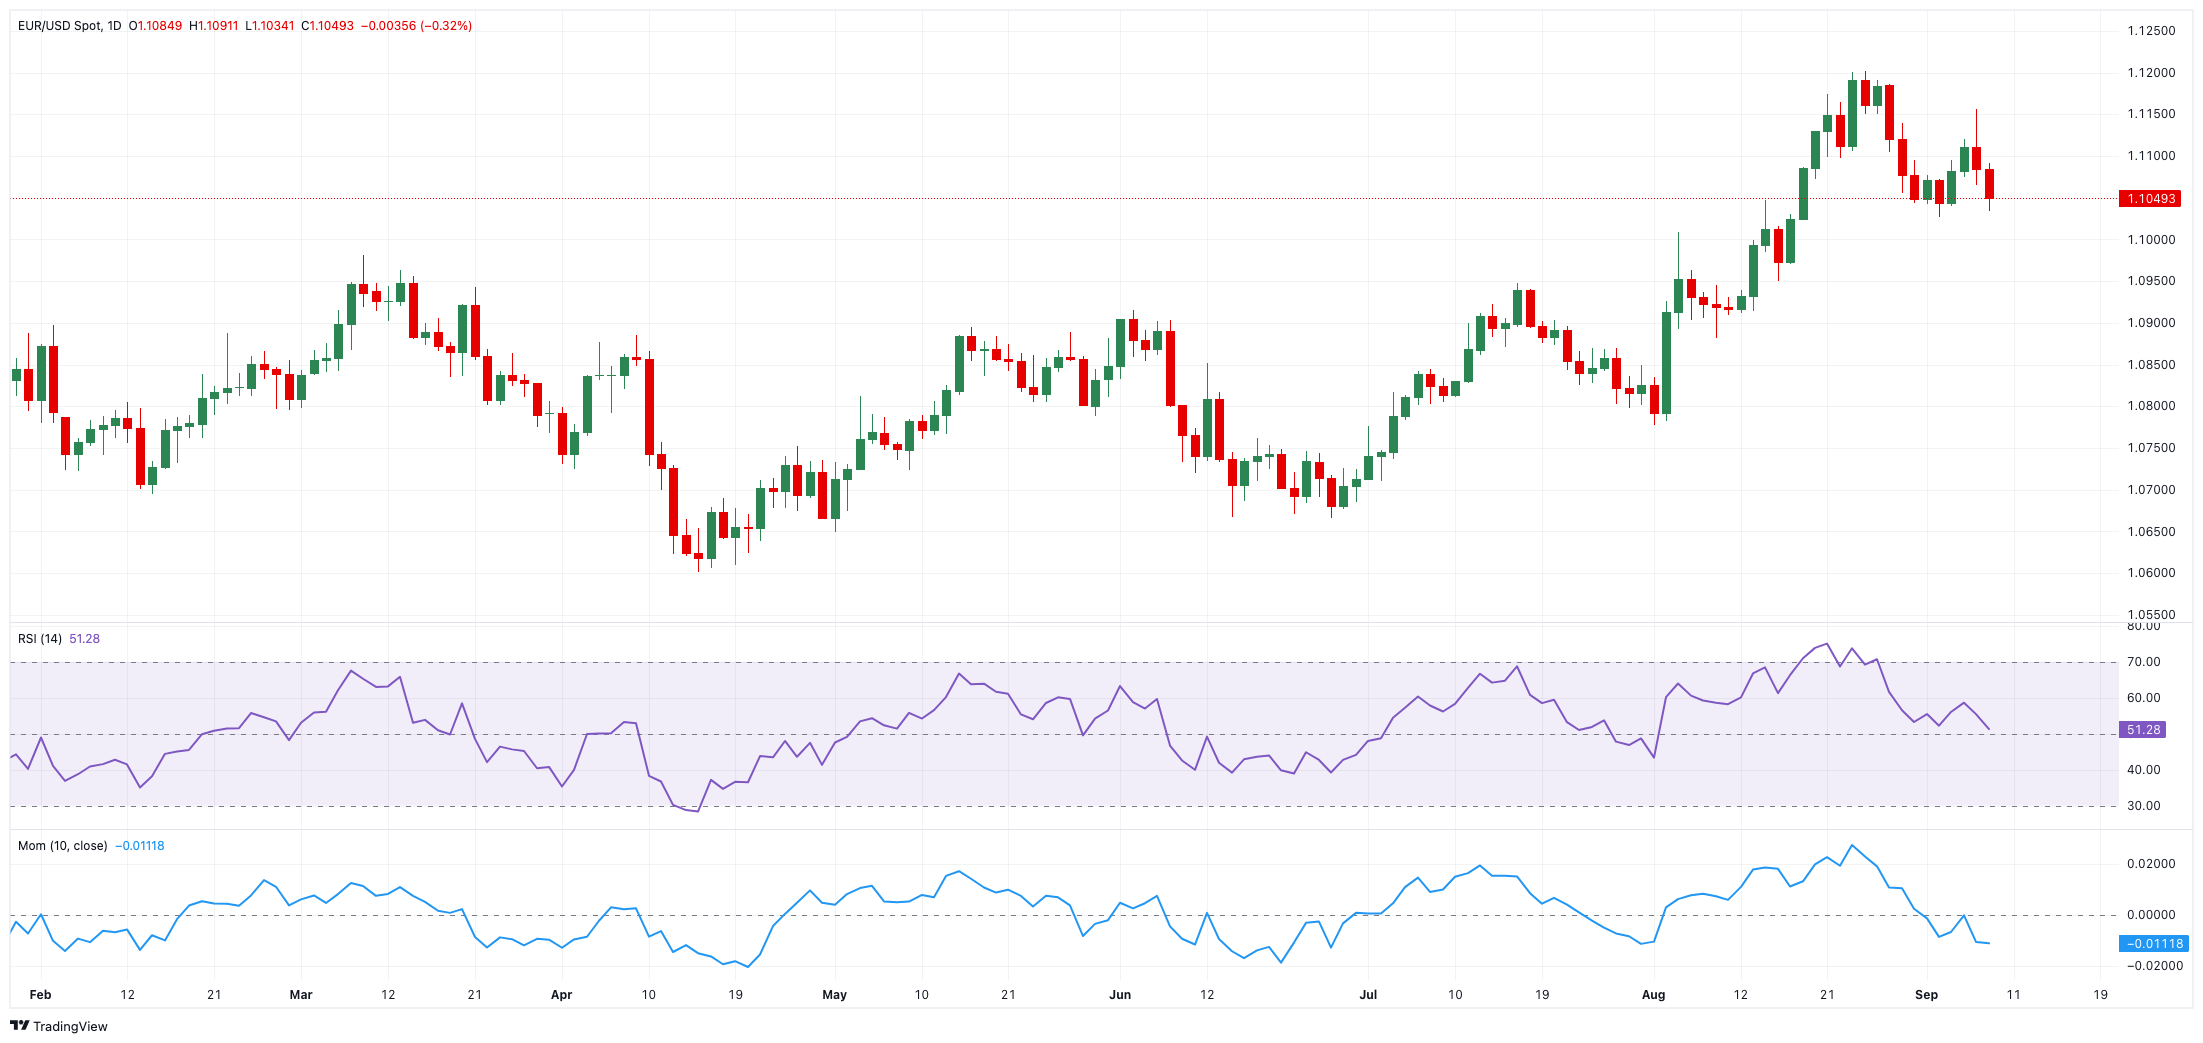
EUR/USD short-term technical outlook
Further north, the EUR/USD is expected to challenge the 2024 top of 1.1201 (August 26), followed by the 2023 peak of 1.1275 (July 18) and the round level of 1.1300.
The pair's next downward target is the September low of 1.1026 (September 3), which is ahead of the preliminary 55-day SMA at 1.0930 and the weekly low of 1.0881 (August 8). Down from here, the critical 200-day SMA is at 1.0857, prior to the weekly low of 1.0777 (August 1) and the June low of 1.0666.
Meanwhile, the pair's rising trend is expected to continue as long as it is above the important 200-day SMA.
The four-hour chart shows a modest comeback to negative sentiment. That said, the initial resistance level is 1.1155, followed by 1.1190 and 1.1201. Instead, there is immediate support at 1.1026, before the 200-SMA of 1.0997, and then 1.0949. The relative strength index (RSI) rose to about 40.
Premium
You have reached your limit of 3 free articles for this month.
Start your subscription and get access to all our original articles.
Author

Pablo Piovano
FXStreet
Born and bred in Argentina, Pablo has been carrying on with his passion for FX markets and trading since his first college years.


