Chart of the Week: Gold to be an exciting display of technicals
- Gold bulls seeking an extension from critical levels of support.
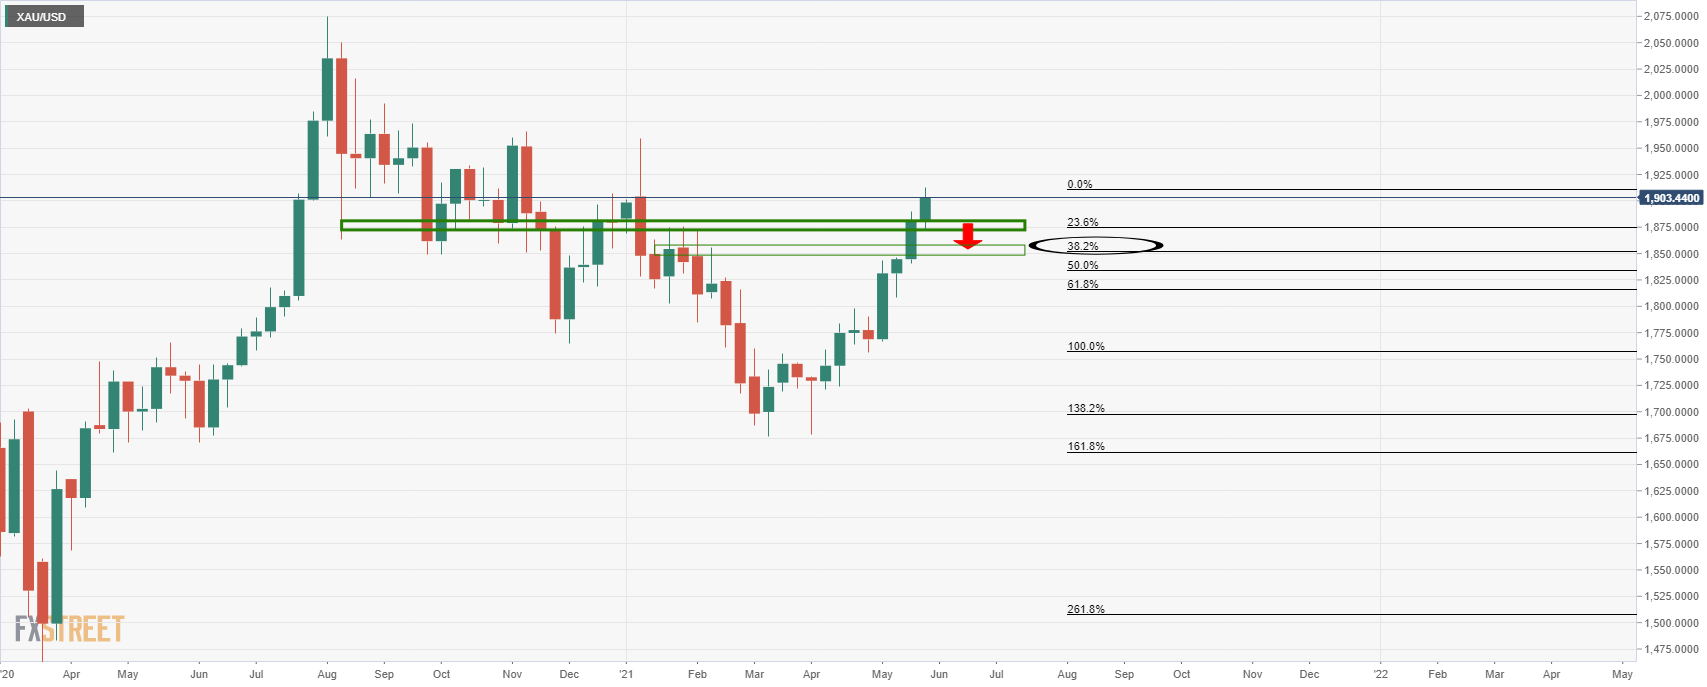
- A break of $1,852 could be game over for the bulls in the meantime.

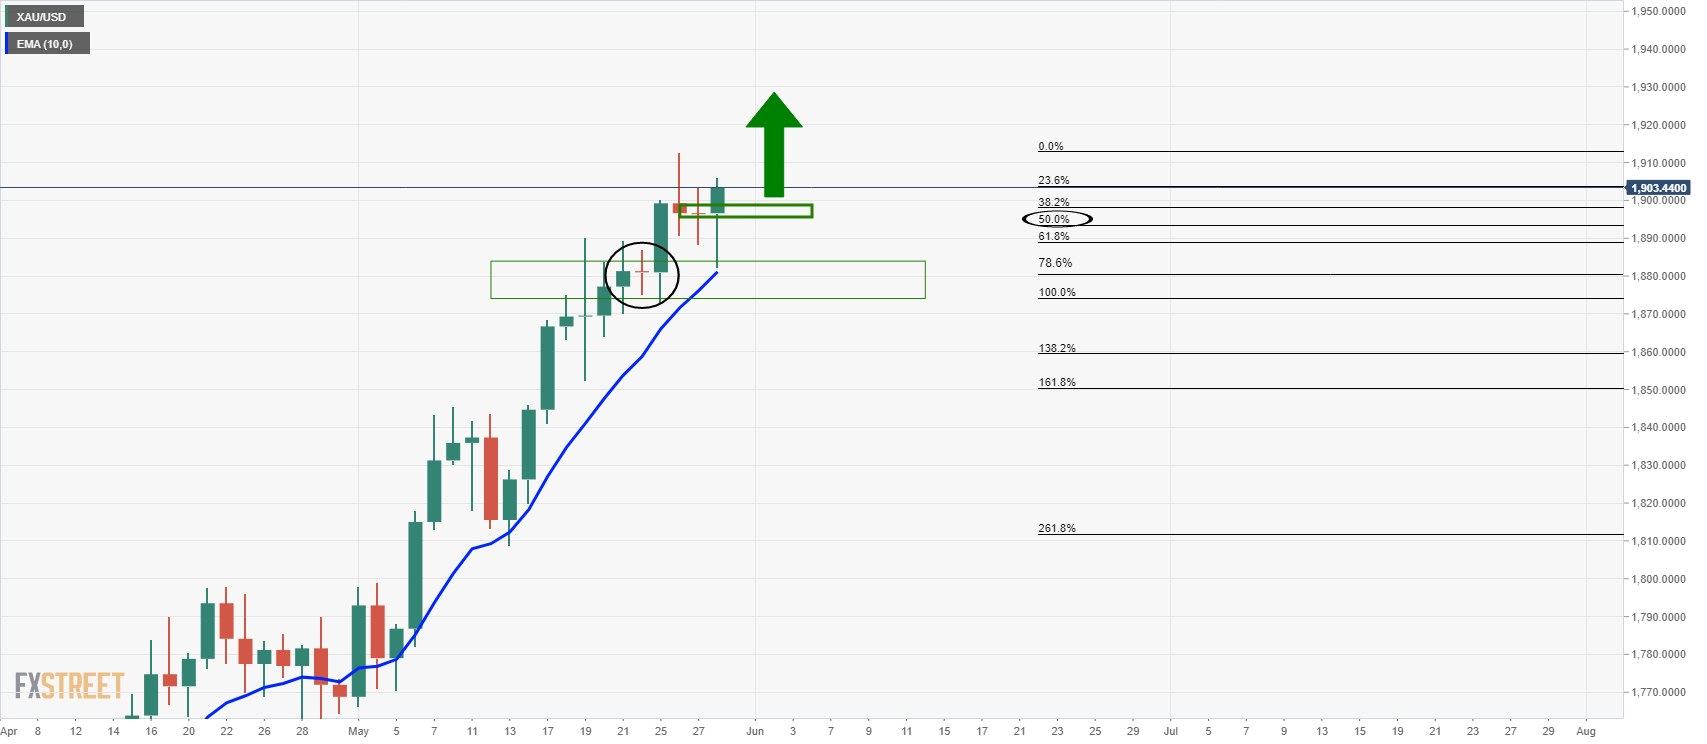
The gold price has made a significant correction to test the confluence of the 78.6% Fibonacci of the prior daily bullish impulse and the 10-day moving average.
This area of support is also the 24 May range that closed bearishly in a doji indicating a strong area of liquidity and potential support.
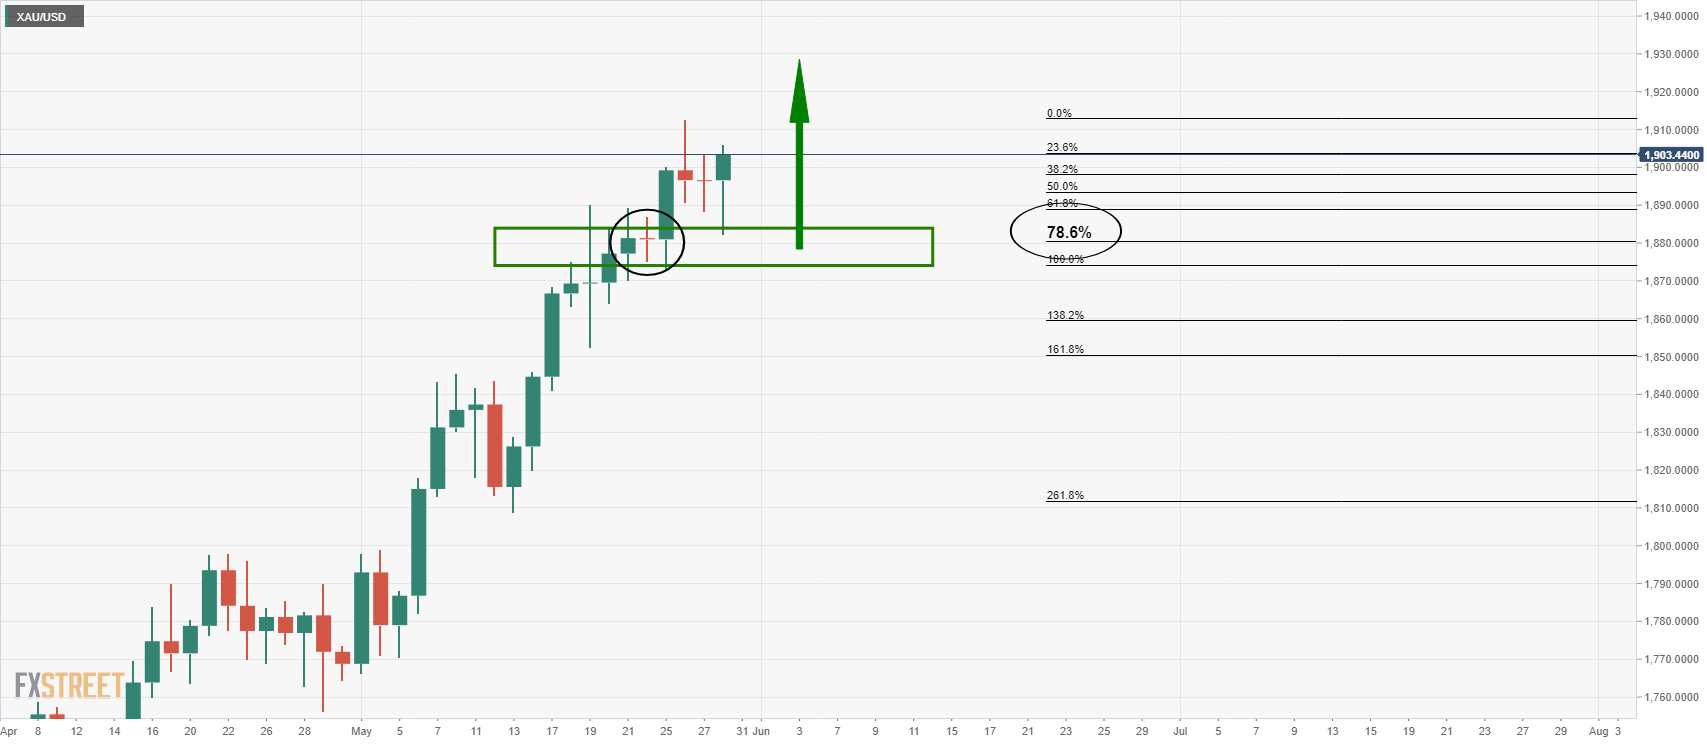
As seen, there has already been a strong rejection of the level, and the open of Friday's price action could well hold for the open at the 50% mark of the current daily range:
Intesteringly, the 4-hour chart's price shows signs of a bullish breakout, but the support structure is yet to be retested, which is something to keep an eye out for in the forthcoming sessions.
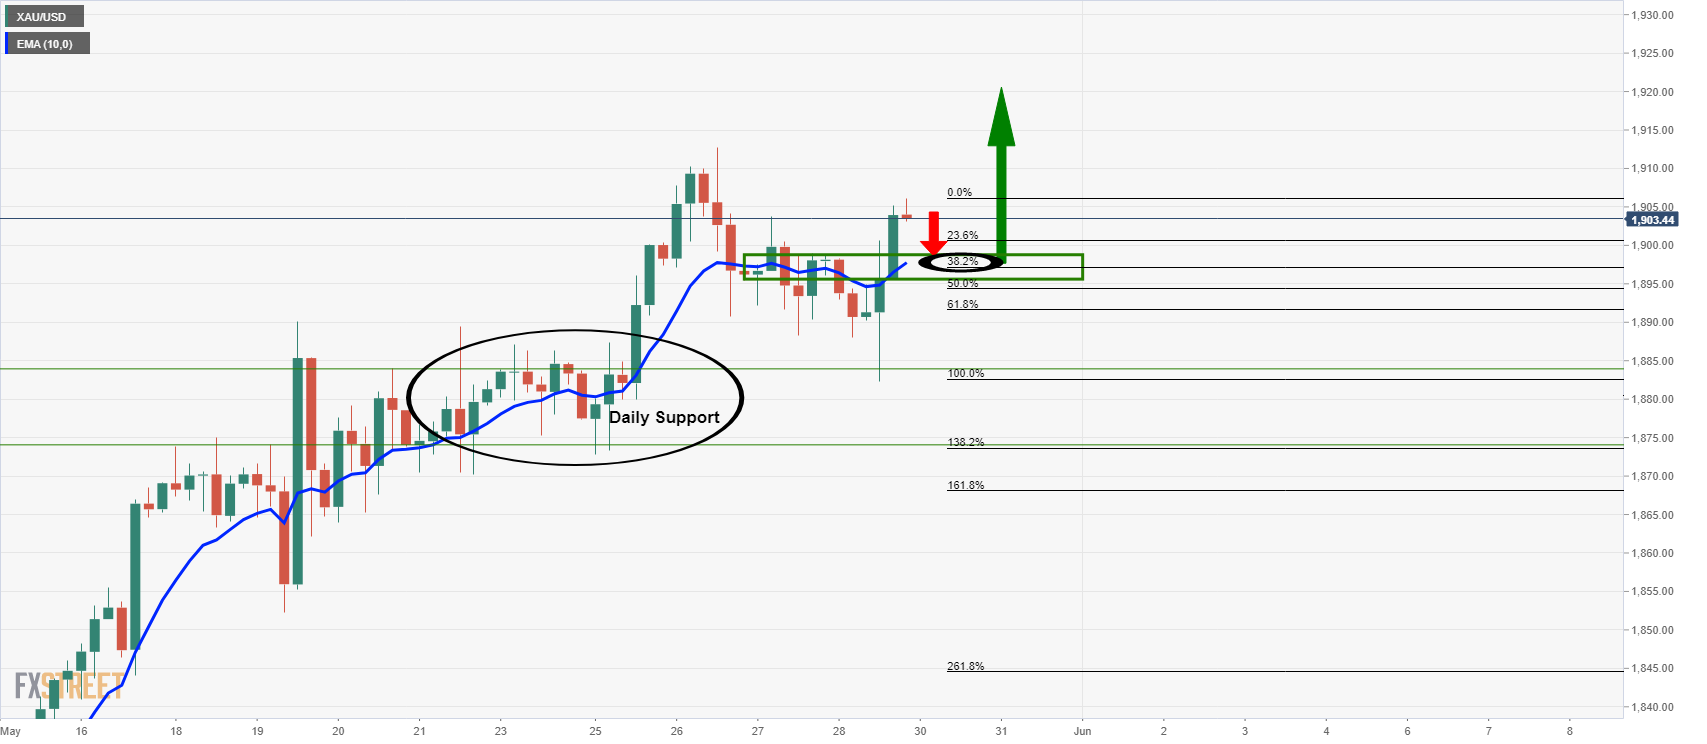
1,898 aligns with the 4-hour 10 EMA in this regard. Daily support at 1,881 remains critical at this juncture.
On the upside, 1,919.50 comes in as the -272% Fibonacci retracement of the current 61.8% Fibo daily correction.
On the downside, however, there are prospects of a move to test the weekly 38.2% Fibo at 1,852 if support gives out.
Author

Ross J Burland
FXStreet
Ross J Burland, born in England, UK, is a sportsman at heart. He played Rugby and Judo for his county, Kent and the South East of England Rugby team.


