Bitcoin Forecast 2018: BTC/USD the star asset of the year, projections from $8,073 to $89,750

2017 has been the year that has taken Bitcoin to phenomenon status, finally spreading across the financial board and leaving the exclusivity of the “geek”/tech universe. 2017 has been the year where those who bet on Bitcoin in the very early stages finally got rewarded with extraordinary returns for their bold confidence in the main cryptocurrency. Since the start of the year, BTC/USD has surged more than 1900%! Yeah, that’s not a typo.
These incredible figures have inevitably tagged Bitcoin as a bubble, with some analysts even mentioning it as the potential new Armageddon that might sink the world economy into another global crisis. And while a big correction isn’t outside the realm of possibilities and the bubble mindset is indeed attached to the current Bitcoin market, BTC is far away from being a risk to the global financial system. The main cryptocurrency doesn’t have enough market cap, it is a quite compartmental market, it’s deleveraged and lacks any associated debt. That’s the current situation, and that, of course, could change. During December 2017, the first headlines about Bitcoin being used as collateral in debt transactions have begun crossing the wires.
Bitcoin’s institutionalization
December 2017 has seen the launch of the first two Bitcoin futures markets. FXStreet does offer for free the Bitcoin Future feed from Chicago Mercantile Exchange (CME). We still are yet to see which implications the openings of these derivative markets have on the Bitcoin price during the next months. The main one may be giving access to institutional investors. The kind of investor, such as investment funds, banks or hedge funds, among others, that could not act in a completely deregulated market as the Bitcoin spot.
Moreover, the birth of Bitcoin futures will allow to develop a sell-side market in the main cryptocurrency, therefore balancing the capital flows that only had one direction (BUY!) up until now.
On the other hand, 2017 has also been the year where Japan, Russia or Norway have accepted Bitcoin as a legal payment method. The European Union is also looking into it, and might tackle it in the upcoming G20 meeting, asking for more regulation on cryptocurrency use. Both Germany and France have expressed their concerns about the lack of transparency of Bitcoin transactions and the potential ability of Bitcoin to put the world economy out of balance.
Bitcoin as a leading “reserve cryptocurrency”
2017 has also been the year where questions about which role may Bitcoin take in the long-term have surfaced. BTC’s current technical settings are not fluid enough to have a meaningful role as a daily, commonly used currency to factor regular economic transactions.
That’s the main reason why the theory of Bitcoin serving as a “reserve cryptocurrency”, thus being the door to enter the cryptocurrency market as a confidence-setter, is gaining traction. Bitcoin might be just an anchor to other, more-efficient Altcoins. That would significantly improve Cryptocurrencies independence from the traditional, fiat currencies.
Potential threats to Bitcoin in 2018
In early December 2017, some hackers stole 4,700 Bitcoins from NiceHash, a cryptocurrency platform, for a value of around $80 million. This is just the last of a long list of incidents of a similar kind conducted by hackers being able to have access to cryptocurrency accounts and take big amounts of money.
Hackers have in Bitcoin a treasure that speaks their language, a treasure that might be theirs to seize if they take their chances. According to Kaspersky, 2018 will be the year of malware code to kidnap calculus capacity. Taking over millions of computers without permission and using them to mine cryptocurrencies might be something we hear about during next year.
2018 also presents a challenge to Bitcoin’s infrastructure. The difficulty that cryptocurrency platforms have to handle traffic peaks has spread a certain amount of insecurity among buyers and sellers who have witnessed how their orders took hours, if not days, to be triggered.
Our Chief Technical Officer, Javier Hertfelder, shares his thoughts:
“From a technical perspective, scalability and energy consumption will be the major challenges for Bitcoin during 2018.
The greatest uncertainty over Bitcoin is the ability to cope with the number of transactions that are supposed to handle a network of its size. Right now, the number of transactions per second that are allowed by Bitcoin are 7, while Visa can handle on average 4000 (peaks of 65000), this results on an average of 10 minutes per transaction. Bitcoin development community has been trying to solve this problem and as a result, at least 6 forks have been produced in the last 3 months. Most of them with the aim to solve the scalability problem. However, none of them have managed to find a long-term solution. From our point of view, the only solution that could be a game changer is "Lightning Network" that basically adds a new layer on the top of the Blockchain and reduces the transactions to only 2, one for opening the peering channel and one to close it.
On the other hand, mining is an incredibly hard task that requires a ton of energy (and then money) to be completed, as it happened with scalability some forks (Bitcoin Gold) are oriented to solve this problem. However, the nature of the problem makes it difficult to find again a real solution. From our point of view, this is where AI can be an excellent associate. For example, Deepmind AI (Google) has reduced energy consumption by almost 40%.
In conclusion, many technical challenges are ahead for Bitcoin over 2018, a cryptocurrency that due to its longevity has some problems that others Cryptos solved from the very beginning. Our prediction is that many forks will be released over the next months until one of them will attract the majority of the community”.
Bitcoin forks: From new rules, new Cryptocurrencies
In August 2017, a group of miners of decent but non-majority proportions decided to increase the capacity of storage for each block in the Blockchain technology that rules Bitcoin. The size of such blocks is around one megabyte, but they wanted to apply a raise to enable up to 8 megabytes for each block. There was not an agreement between both parts of the community, but this group didn’t renounce and Bitcoin’s Blockchain split in two parts, resulting in the creation of Bitcoin Cash. There have been many other proposals that gave birth to other Cryptocurrencies from the original Bitcoin:
August 1st 2017 - Bitcoin Cash
Split from Bitcoin, handles up to 8 MB instead of the original 1 MB
October 24th 2017 - Bitcoin Gold
Split from Bitcoin, looking for more decentralization and equality between mining technologies
November 24th 2017 - Bitcoin Diamond
Split from Bitcoin, increasing the size of the block up to 8 MB, but also velocity of transactions and security through encryptation
Bitcoin Technical Outlook for 2018
BTC 1-month forecast
For this BTC/USD one-month analysis, we will use the 4H chart, looking for a balanced amount of information and timeframe width. This chart starts around early October 2017, back when Bitcoin was trading around $5,000
All-time highs at the time of writing this article were set at $19,811.28. A pronounced divergence in the MACD, a significant increase in the number of sellers and the huge distance between the current price and its moving averages make the chances of a potentially bearish scenario in the upcoming weeks quite notable.
BTC/USD 4H chart
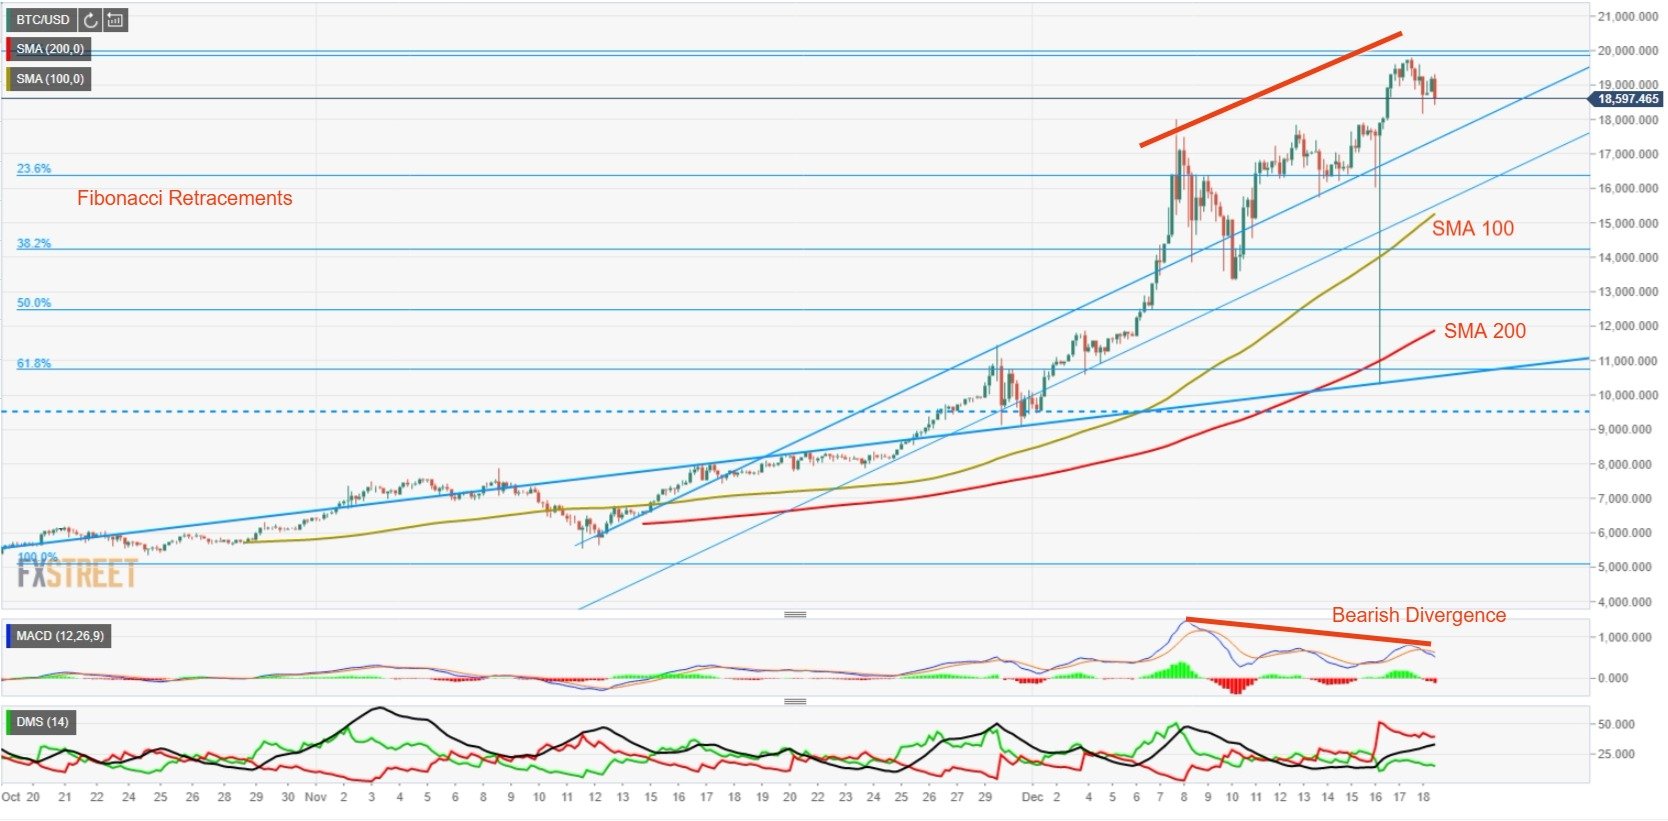
If this bearish scenario develops further, target prices to the move will be:
- First bearish target is around $16,305-$16,300 (23.6% Fibonacci retracement)
- Second bearish target is around $15,225-$15,250 (100-SMA)
- Third bearish target is around $14,216-$14,980 (38.2% Fibonacci retracement)
- Fourth bearish target is around $11,850-$12,000 (200-SMA)
BTC/USD 4H chart bullish targets

As a potential bullish scenario, which even if less probable, isn’t out of chances, Bitcoin is very close to all-time highs. That leaves us with few price landmarks:
- First bullish target is at $20,823 (161.8% Fibonacci extension of the previous bearish movement)
- Second bullish target is at $25,393 (261.8% Fibonacci extension of the previous bearish movement)
BTC 1-quarter forecast
We take the daily chart in order to make the quarterly forecast. Once we’ve developed the potential scenarios for the monthly timeframe, let’s see if the same course of action works for this longer timeframe.
BTC/USD daily chart
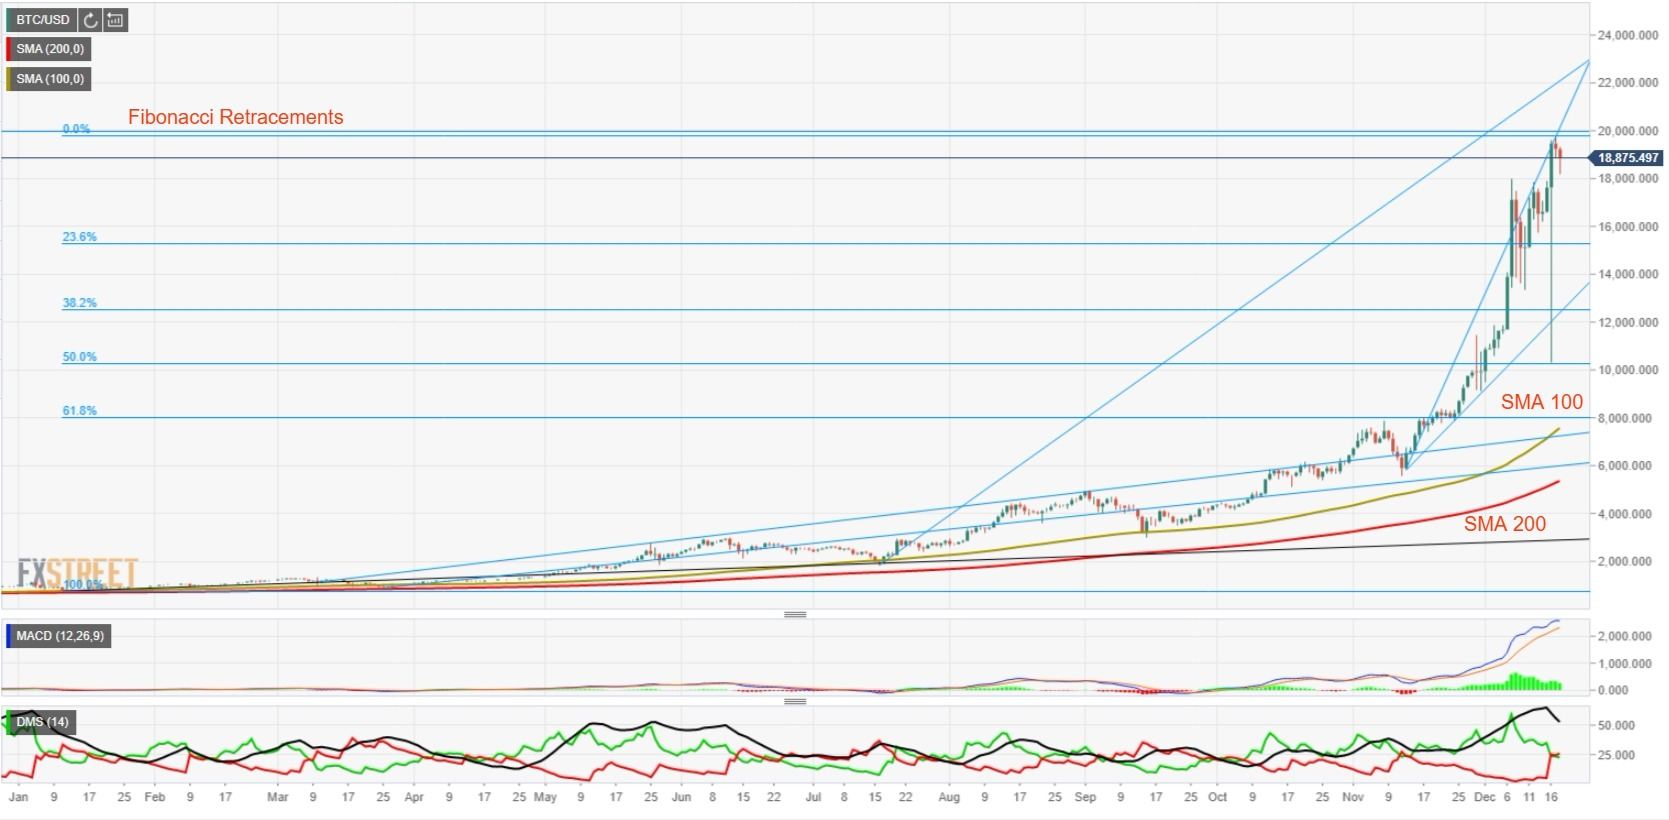
The most probable scenario is one of a bearish move during the first weeks of the year, the time needed just for the MACD line to get closer to the signal. Once both meet, we should follow closely a “MACD fail” pattern to determine the following Bitcoin price action.
Directional Movement Index shows an ADX on a strong bullish trend but now diminishing and a tie situation between buyers and sellers, with a slight edge for the latter ones. This is a setup that tends to bring uncertainty.
All in all, the first quarter of 2018 should carry a bearish trend from the last weeks of 2017, followed by a small step upwards and before a third bearish segment.
- First bearish target is at $15,269 (23.6% Fib retracement)
- Second bearish target is at $12,545 (38.2% Fib retracement)
- Third bearish target is at $10,274 (50% Fib retracement)
- Fourth bearish target is at $8,073 (61.8% Fib retracement and 100-SMA)
On the bullish side, bullish targets are the same as in the monthly and yearly timeframes.
BTC yearly forecast
If trying to conduct a price forecast for a one-year target is already a very difficult task, forecasting an asset like Bitcoin in a yearly timeframe is close to impossible. That’s why I ask for great doses of caution ahead of the next lines I’ve written.
For the ultra-lengthy timeframe, I’m using historic trendlines, one of the few tools that are useful in scenarios like this one, with enough odds to make it a relevant one.
BTC/USD daily chart
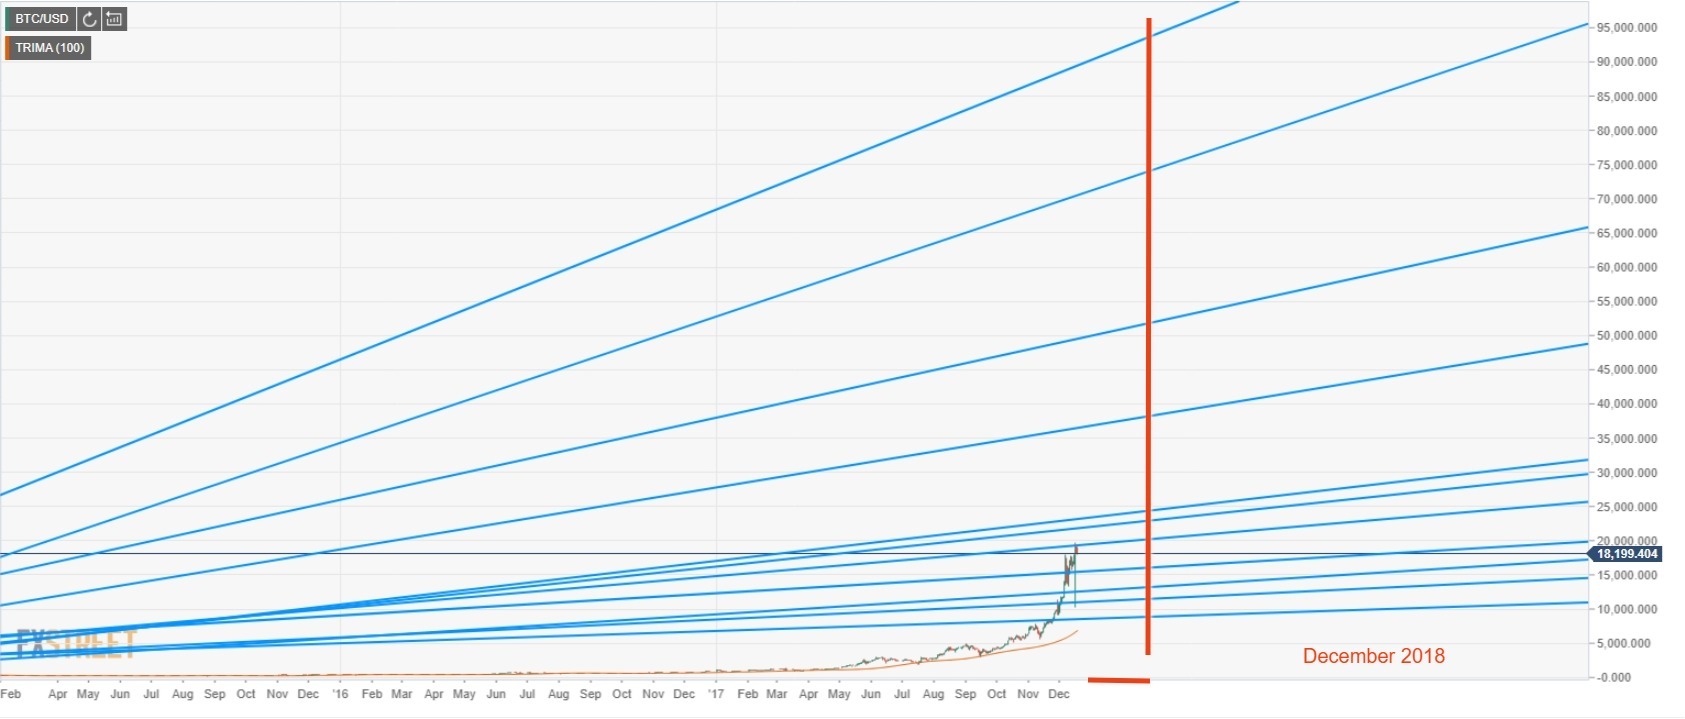
In this chart, I’ve taken a look at the details of the past trends drawn back in 2012, 2013 and 2014 and I have projected them into the future.
This kind of study usually works well as a reference, completing the analysis with another one in a shorter timeframe when the price gets closer to this ultra-lengthy trendlines.
We should take into account that thanks to the inclination of these trendlines, the time weighs a lot into price levels, so that’s why I’m projecting it into six months and one year.
BTC/USD daily chart (1-year projection)
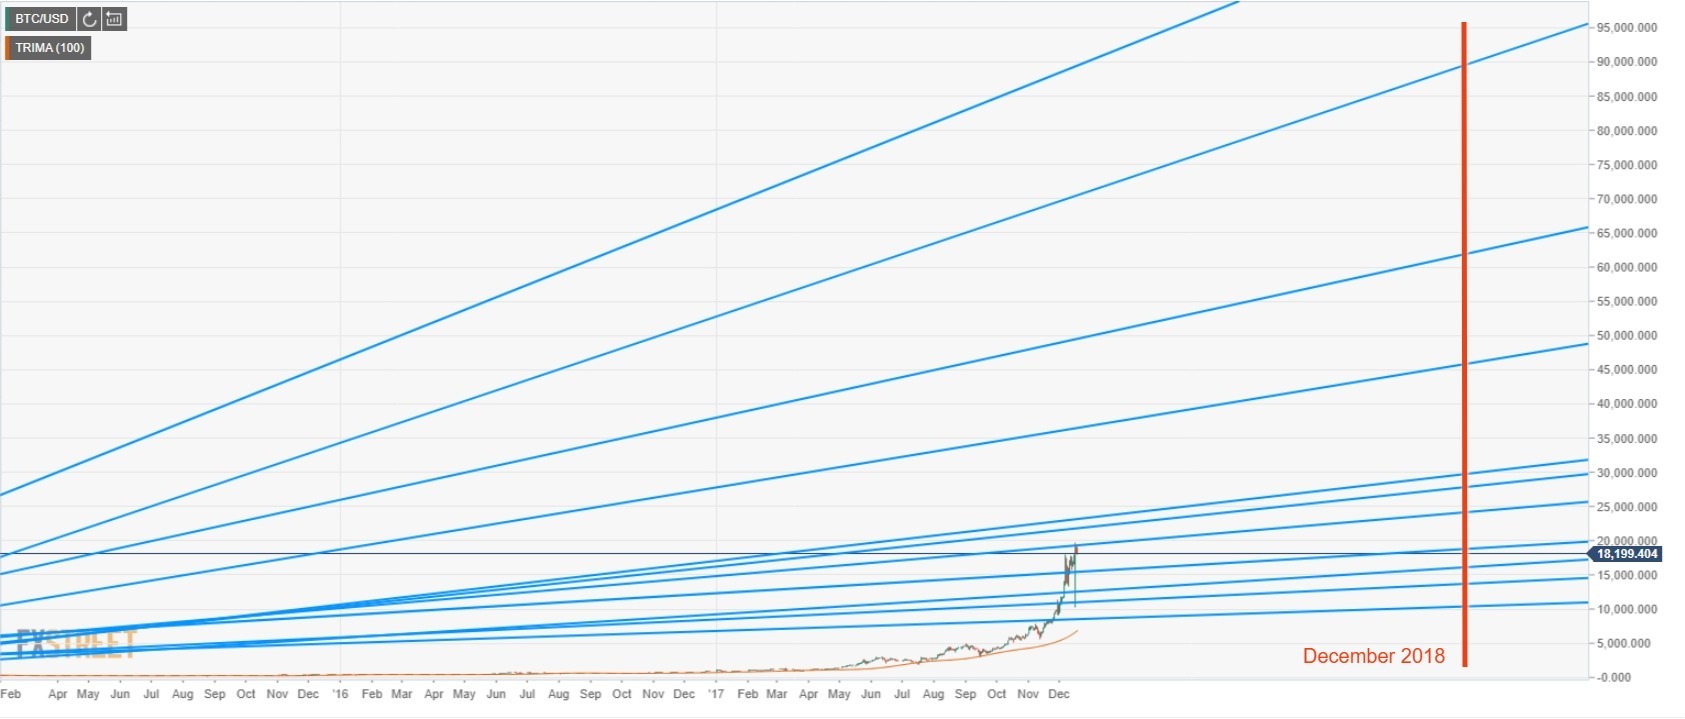
Getting into detail, we see that the ultra-lengthy trends give us the following target levels for December 2018:
- First target: $28,900
- Second target: $29,930
- Third target: $46,175
- Fourth target: $62,250
- Fifth target: $89,750
On the bearish side, we stick to the same support levels from the quarterly analysis.
Conclusion
Bitcoin is the star asset of the 2017 and has all the numbers to repeat in 2018. The risks an investor takes when entering the Bitcoin market are as high as the rewards that might be gotten.
Bitcoin is an evolving project and the probable continuation of forks, even if they are hard or soft, will keep going. There are lots of technical challenges that need to be addressed by Bitcoin and the crypto sphere. Bitcoin’s role in the future will depend basically on how its technology evolves and improves.
On the other hand, regulatory pressure and control from central bankers and governments are already there and increasing.
From a price action point of view, Bitcoin will surely be the asset to track and we will be there to report about it accordingly.
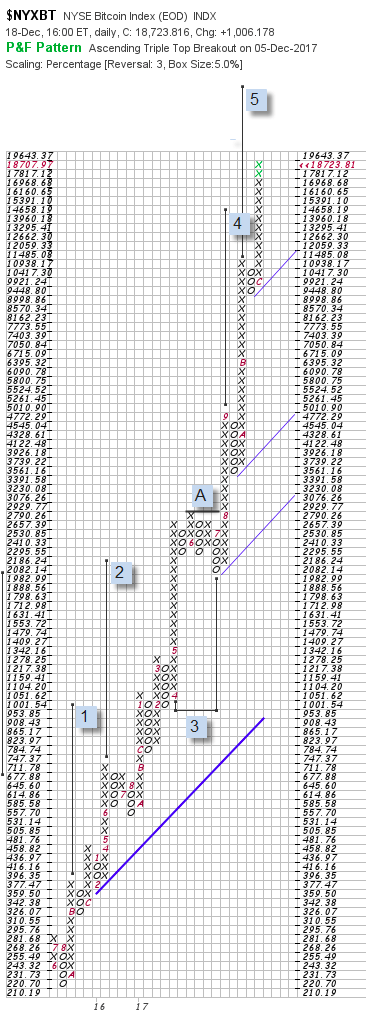
Bitcoin Point & Figure Chart

Tracking an exceptionally strong rally, we have opted to assign a more or less liberal count to the trend and, in that case, we come up with counts 1, 2 and 4 which have been achieved in 2016, and a count 5 pointing to 32,814 before we reach a potential reversal point. This is the only active count under this chart resolution since the only opposing count (3) has been negated at point A.
The current chart uses a logarithmic scale with a box size of 5%and reversal set at 3 boxes (approx 15%). Should no reversal pattern be printed before the aforementioned target is hit, then a wide swath of land would emerge to 98,000 USD per Bitcoin.
Internal 45º degree lines can compensate for the lack of downside targets, the first hurdle to test the bulls would come in the 4000s.
Author

Tomas Salles
FXStreet
Tomàs Sallés was born in Barcelona in 1972, he is a certified technical analyst after having completing specialized courses in Spain and Switzerland. He expanded his technical training following the guidance of great experts on the financial markets.