Xylem Inc. (XYL) begins a new Elliott Wave bullish cycle

Xylem Inc. (XYL) has completed its wave (2) correction and is now poised to rally in wave (3) of (III), according to Elliott Wave analysis
Xylem Inc. (NYSE: XYL) continues to respect its long-term Elliott Wave structure with impressive precision. As seen in the weekly chart, the stock recently completed a corrective wave (2) and appears to be resuming a new bullish leg within a larger impulsive cycle. The broader trend remains bullish as the price action aligns perfectly with the Elliott Wave Principle.
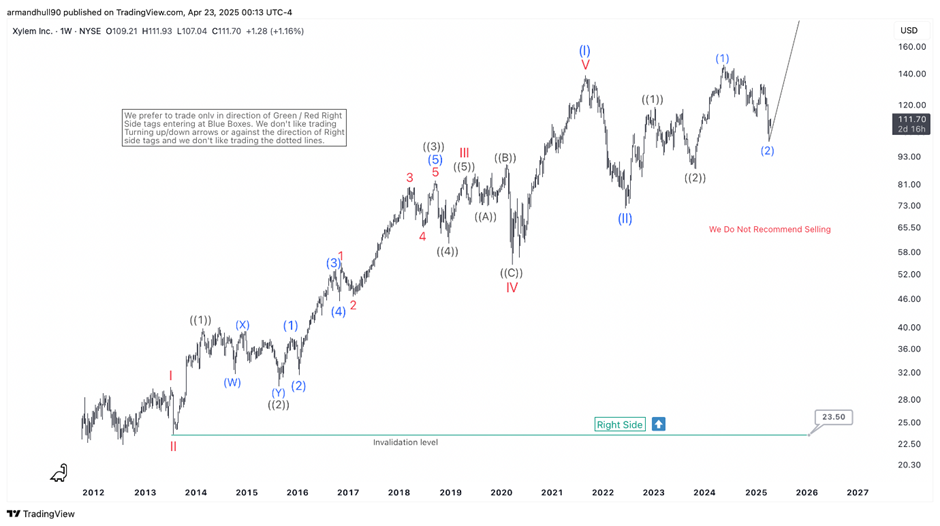
From the 2009 low, XYL has progressed in a multi-decade impulsive structure. The rally unfolded in five waves to form wave (I), which peaked in 2021. This was followed by a significant three-wave correction labeled as wave (II), bottoming in 2022. Since then, the stock has embarked on another five-wave impulse higher, beginning wave (III). Within that cycle, we can observe the completion of wave (1) and a recent pullback that likely marks the end of wave (2).
Since then, the stock has begun a new advance. The recent structure shows completing wave (1) of ((III)), followed by a three-wave correction labeled as wave (2). This pullback is now likely complete, and the next leg higher in wave (3) is expected to unfold.
The “Right Side” tag remains bullish. This encourages traders and investors to stay aligned with the trend and avoid selling prematurely. The bullish scenario holds as long as the price remains above the invalidation level of $23.50. Xylem’s technical setup favors further upside. Traders may look to buy pullbacks while respecting key structural levels. As the wave (3) rally unfolds, new highs toward and beyond the $160 mark could be seen in the coming months.
Conclusion:
Xylem Inc. appears to have completed a textbook wave (2) correction and is likely starting a new bullish phase. With structure and momentum favouring the upside, the long-term view remains bullish as the next leg higher unfolds.
Author

Elliott Wave Forecast Team
ElliottWave-Forecast.com


