In this technical blog, we are going to take a look at the past performance of one hour Elliott Wave charts of XLP a consumer staple ETF. In which, the rally from 16 April 2024 lows, showed the higher high sequence in higher time frame charts favored more strength. Also, the right side tag pointed higher against $74.71 low seen on 5/01/2024 low called for more upside. We will explain the structure and forecast below:

XLP one-hour Elliott Wave chart from 5.14.2024

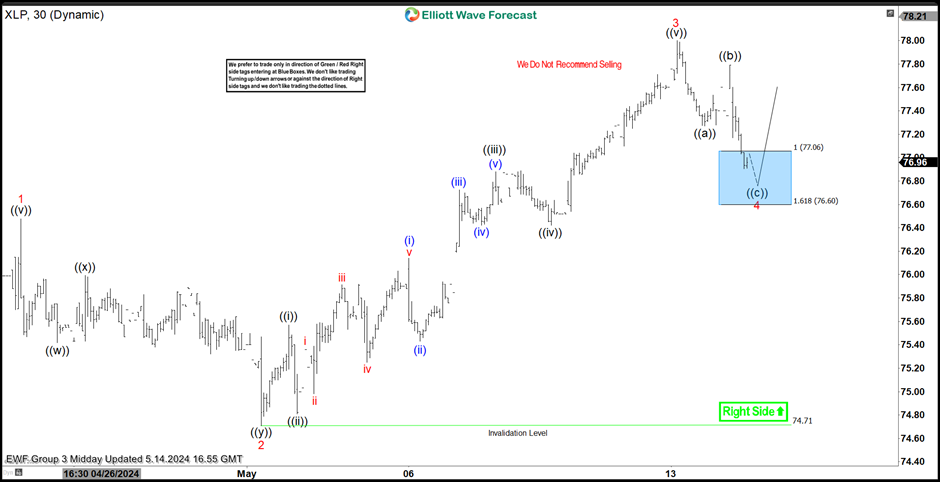
XLP one hour Elliott Wave Chart from 5/14/2024 Midday update, in which the ETF ended the 5 waves rally within wave 3 at $78 high. Down from there, the pullback in wave 4 took place in 3 swings as zigzag structure, which managed to reach $77.06-$76.60 100%-161.8% Fibonacci extension area of ((a))-((b)). Thus provided buying opportunity to our members at the blue box area looking for the next extension higher or for 3 wave reaction higher at least.

XLP one-hour Elliott Wave chart from 5.19.2024

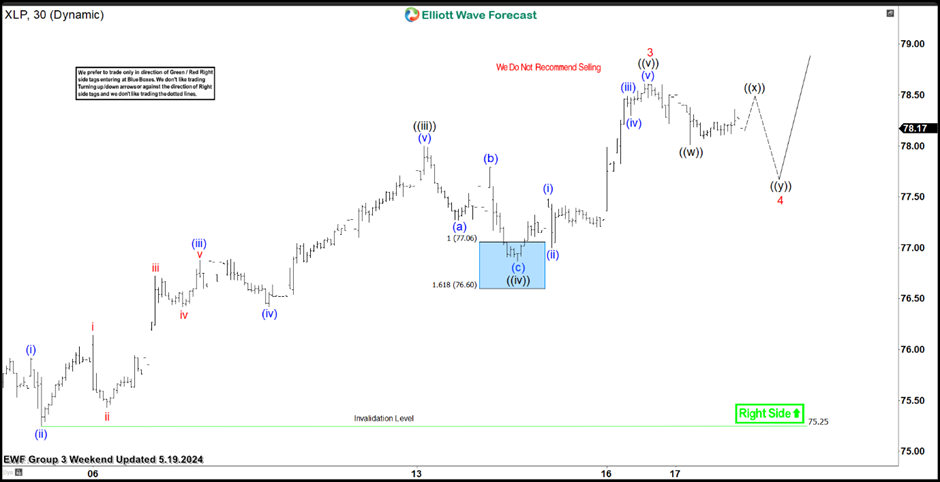
Here’s one hour Elliott Wave chart from 5/19/2024 weekend update, in which the ETF is showing reaction higher taking place from the blue box area. And shortly after taking the trade the ETF bounced strongly & managed to make a new high above the previous high confirmed the next extension higher. Also, with this rally higher the ETF allowed our members to take profits from the bounce higher.

Share: Feed news

FURTHER DISCLOSURES AND DISCLAIMER CONCERNING RISK, RESPONSIBILITY AND LIABILITY Trading in the Foreign Exchange market is a challenging opportunity where above average returns are available for educated and experienced investors who are willing to take above average risk. However, before deciding to participate in Foreign Exchange (FX) trading, you should carefully consider your investment objectives, level of xperience and risk appetite. Do not invest or trade capital you cannot afford to lose. EME PROCESSING AND CONSULTING, LLC, THEIR REPRESENTATIVES, AND ANYONE WORKING FOR OR WITHIN WWW.ELLIOTTWAVE- FORECAST.COM is not responsible for any loss from any form of distributed advice, signal, analysis, or content. Again, we fully DISCLOSE to the Subscriber base that the Service as a whole, the individual Parties, Representatives, or owners shall not be liable to any and all Subscribers for any losses or damages as a result of any action taken by the Subscriber from any trade idea or signal posted on the website(s) distributed through any form of social-media, email, the website, and/or any other electronic, written, verbal, or future form of communication . All analysis, trading signals, trading recommendations, all charts, communicated interpretations of the wave counts, and all content from any media form produced by www.Elliottwave-forecast.com and/or the Representatives are solely the opinions and best efforts of the respective author(s). In general Forex instruments are highly leveraged, and traders can lose some or all of their initial margin funds. All content provided by www.Elliottwave-forecast.com is expressed in good faith and is intended to help Subscribers succeed in the marketplace, but it is never guaranteed. There is no “holy grail” to trading or forecasting the market and we are wrong sometimes like everyone else. Please understand and accept the risk involved when making any trading and/or investment decision. UNDERSTAND that all the content we provide is protected through copyright of EME PROCESSING AND CONSULTING, LLC. It is illegal to disseminate in any form of communication any part or all of our proprietary information without specific authorization. UNDERSTAND that you also agree to not allow persons that are not PAID SUBSCRIBERS to view any of the content not released publicly. IF YOU ARE FOUND TO BE IN VIOLATION OF THESE RESTRICTIONS you or your firm (as the Subscriber) will be charged fully with no discount for one year subscription to our Premium Plus Plan at $1,799.88 for EACH person or firm who received any of our content illegally through the respected intermediary’s (Subscriber in violation of terms) channel(s) of communication.

Recommended content


Recommended content

Editors’ Picks

EUR/USD extends slide below 1.0700 on stronger USD, EU political angst

EUR/USD extends slide below 1.0700 on stronger USD, EU political angst

EUR/USD stays under bearish pressure and trades at its lowest level since early May below 1.0700. Unabated US Dollar demand amid risk aversion and looming EU political uncertainty exert downside pressure on the pair heading into the weekend.

EUR/USD News

GBP/USD slumps to multi-week lows below 1.2700

GBP/USD slumps to multi-week lows below 1.2700

GBP/USD extends its decline on Friday and trades at its lowest level in nearly a month below 1.2700. In the absence of high-tier data releases, the US Dollar continues to benefit from souring market mood, forcing the pair to stretch lower in the second half of the day.

GBP/USD News

Gold clings to recovery gains at around $2,330

Gold clings to recovery gains at around $2,330

Following Thursday's pullback, Gold holds its ground on Friday and trades in positive territory near $2,330. The benchmark 10-year US Treasury bond yield edges lower toward 4.2%, helping XAU/USD push higher ahead of the weekend.

Gold News

Monero price poised for a downward correction

Monero price poised for a downward correction

Monero price has encountered resistance at a critical level. The technical outlook suggests a potential short-term correction as momentum indicators signal a bearish divergence.

Read more

Week ahead – RBA, SNB and BoE next to decide, CPI and PMI data also on tap

Week ahead – RBA, SNB and BoE next to decide, CPI and PMI data also on tap

It will be another central-bank-heavy week with the RBA, SNB and BoE. Retail sales will be the highlight in the United States. Plenty of other data also on the way, including flash PMIs and UK CPI.

Read more

Forex MAJORS

Cryptocurrencies

Signatures