|

WTI slumps on soft demand from US and China as traders brace for US CPI

  • End of summer vacations in the US leads to lower demand. China’s gradual recovery after lifting stringent Covid-19 measures further diminishes demand.
  • Saudi Arabia and Russia extending their crude oil production cushioned WTI’s price drop.
  • WTI Technical: A ‘spinning-top’ candlestick from Monday implies bullish momentum might wane.

Western Texas Intermediate (WTI), the US crude oil benchmark, fell 0.16% on Monday due to traders bracing for weaker demand from the United States (US) and China. Hence, WTI is trading at $82.45, below its opening price, after hitting a daily high of $83.26.

Seasonal demand dip and China’s sluggish recovery pressure oil, though Saudi Arabia’s production cut offers some support

Market sentiment remains upbeat as Wall Street closed with gains. The end of summer vacations in the US is one of the drivers that weakened oil prices as a result of lower demand due to seasonal factors. In the meantime, China’s struggles to recover after lifting Covid-19 zero-tolerance restrictions supported oil’s rally, but its recovery slowed as the year progressed.

Meanwhile, after detecting a leak in central Poland, a pipeline that delivers oil from Poland to Europe would resume oil flows on Tuesday, easing worries about supply constraints.

Although those reasons would weigh WTI’s price, Saudi Arabia’s extension of its 1 million crude oil production cut to September cushioned the oil price fall. That, alongside Russia’s commitment to cut its exports by 300K barrels per day (bpd).

WTI traders focus the rest of the week on the US Consumer Price Index (CPI) report for July. A rise in prices in the United States (US), could trigger a hawkish reaction by the US Federal Reserve (Fed), which could remain increasing rates, augmenting demand for the greenback. Consequently, a strong US Dollar would weigh on US Dolllar-denominated assets, like WTI.

WTI Price Analysis: Technical outlook

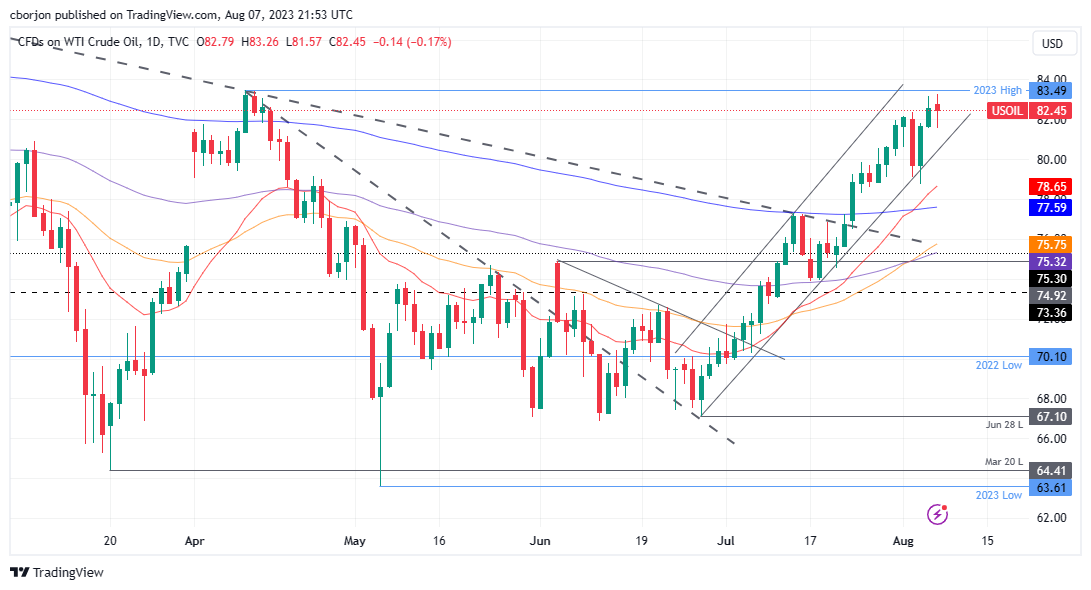
From a daily chart perspective, WTI is in an uptrend though it remains shy of breaking above the $84.00 per barrel figure, which could exacerbate a test of the November 11, 2022, daily high of $90.08. Nevertheless, Monday’s reversal day printed a ‘spinning-top’ candlestick, suggesting that buyers are losing momentum, ahead of breaking above the year-to-date (YTD) high of $83.49. That said, if WTI breaks above the latter, that would expose $84.00, followed by the psychological $84.50 area, before testing $85.00. Conversely, if WTI drops below Monday’s low of $81.57, that could trigger a correction towards the $80.00 per barrel, followed by the 20-day EMA.

WTI Daily chart

WTI US OIL

Overview
Today last price82.19
Today Daily Change-0.11
Today Daily Change %-0.13
Today daily open82.3
 
Trends
Daily SMA2077.85
Daily SMA5073.5
Daily SMA10074.05
Daily SMA20076.43
 
Levels
Previous Daily High82.88
Previous Daily Low81.24
Previous Weekly High82.88
Previous Weekly Low78.49
Previous Monthly High81.78
Previous Monthly Low69.77
Daily Fibonacci 38.2%82.25
Daily Fibonacci 61.8%81.86
Daily Pivot Point S181.4
Daily Pivot Point S280.5
Daily Pivot Point S379.76
Daily Pivot Point R183.04
Daily Pivot Point R283.78
Daily Pivot Point R384.69

Author

Christian Borjon Valencia

Markets analyst, news editor, and trading instructor with over 14 years of experience across FX, commodities, US equity indices, and global macro markets.

More from Christian Borjon Valencia
Share:

Editor's Picks

AUD/USD stays bid above 0.7100 on Australian trade data, Mideast optimism

AUD/USD clings to minor recovery gains above 0.7100 in the Asian session on Thursday as a new Israel-Lebanon ceasefire keeps a lid on the safe-haven US Dollar. Meanwhile, strong AustralianTrade Balane data also help the Aussie pair sustain the bounce from weekly lows.

USD/JPY hovers near the 160.00 intervention threshold on Mideast tensions

USD/JPY struggles to find acceptance above 160.00 and retreats from a one-month high in the Asian session on Thursday amid fears that authorities will step in again to prop up the Japanese Yen. Furthermore, a new Israel-Lebanon ceasefire caps the US Dollar and supports the currency pair. However, renewed US-Iran tensions keep the downside limited in the Greenback and the pair.

Gold rebounds from one-week low as Israel-Lebanon truce pressures safe-haven USD

Gold gains some positive traction on Thursday and climbs to the $4,475 area during the Asian session, reversing a major part of the previous day's slide to a one-week low. The Israel-Lebanon truce prompts some profit-taking around the US Dollar and supports the commodity. 


Ethereum: Long-term holders' capitulation drives ETH below $1,800

Ethereum has fallen below $1,800 on Wednesday, the first time since May 2025 following accelerated spot selling pressure and distributions from long-term holders. The Age Consumed metric, which tracks the movement of previously idle tokens or long-term holders' coins, spiked over the past two days as prices declined, indicating increased selling activity among this cohort.

Kevin Warsh takes the Fed helm: What it means for the US Dollar
The Federal Reserve moves away from the highly predictable "forward guidance" model of the Jerome Powell era to a new “Kevin Warsh environment”, characterized by less communication, more policy surprises, and an increased focus on the Fed's complex balance sheet.
Recession on paper: What really moves the Canadian Loonie now?

Statistics Canada handed the headline writers a gift and the analysts a headache. Real GDP shrank 0.1% on an annualized basis in the first quarter, and with the fourth quarter of 2025 revised down to a 1.0% contraction, that is two negative quarters in a row, the textbook definition of a technical recession and Canada's first since the pandemic.