• The US crude oil benchmark lost some 0.83% on Tuesday, weighed by oil’s news aiming to increase supply.
  • Sentiment shifted sour, augmenting appetite for safe-haven assets to the detriment of commodity prices.
  • According to the Department of Treasure, previous releases from SPR and foreign partners brought gasoline prices  down by “40 cents per gallon.”

The US crude oil benchmark, WTI, slides for the first time in the week, down some 0.83%, and is trading at $95.58 BPD at the time of writing. A risk-off mood, dented appetite for the black gold. US companies reporting earnings, and one of the biggest US retailers, blaming high inflation as one of the factors that spurred a slash in profits, kept investors on their toes.

WTI falls on recession fears as the WH taps the SPR reserves

Alongside the abovementioned, on Monday, prices spiked on news that Russia’s Gazprom slashed natural gas flows to Europe from 40 to 20%, as Moscow reported that the missing turbine was on its way to maintenance but had not been installed. WTI reacted upwards to the announcement and closed around $96.26 BPD.

Sources cited by Reuters said, “The announcement revived fears that Russia, despite its cynical denial, will not shy away from using its energy as a weapon in order to gain concessions in its war against Ukraine and ... could probably expect short-term success.”

On Tuesday, earlier in the North American session, EU countries agreed to reduce gas use for the following winter, which was cheered by oil bears, further pushing prices lower. Furthermore, the White House (WH) announced it would sell 20 million barrels from the Strategic Petroleum Reserve. The WH said it would repurchase oil “in future years, likely after 2023.”

Linked to the previously mentioned, the Department of Treasure said that the previous releases from the SPR, alongside releases of crude oil from foreign partners, helped reduce gasoline prices by “about 40 cents per gallon.”
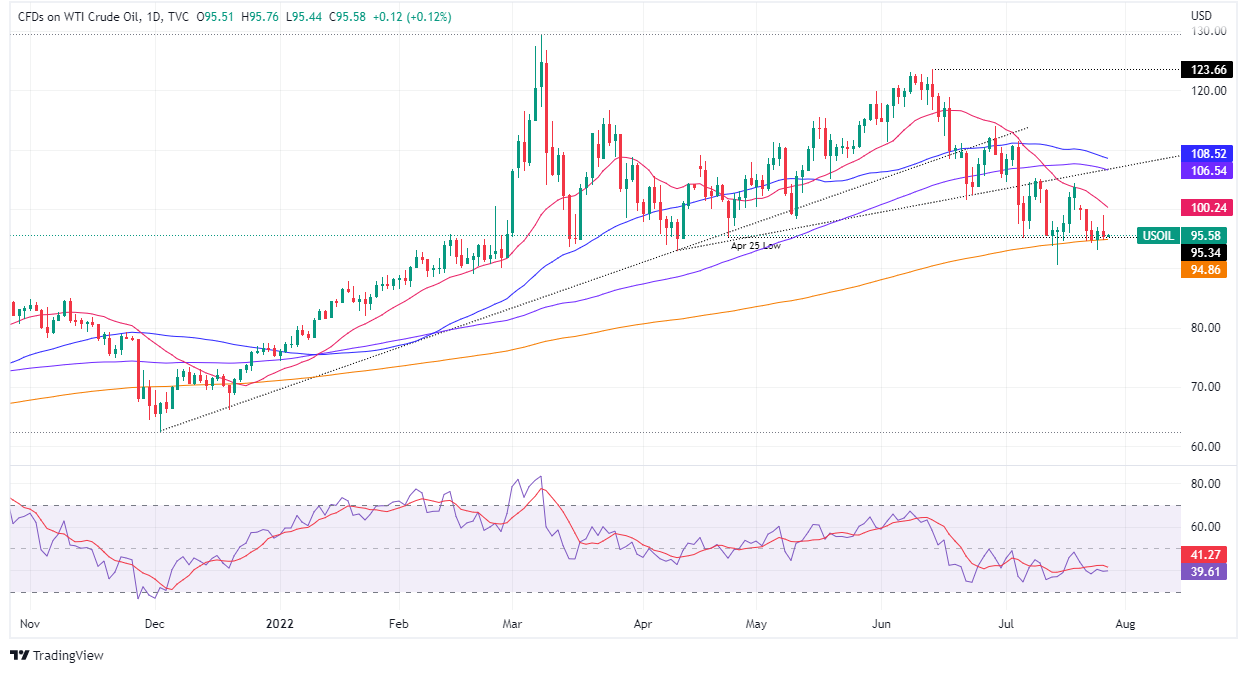
WTI Daily chart

WTI Key Technical Levels

WTI US OIL

Overview
Today last price 95.58
Today Daily Change -1.07
Today Daily Change % -1.12
Today daily open 95.82
 
Trends
Daily SMA20 99.83
Daily SMA50 107.48
Daily SMA100 105.78
Daily SMA200 93.73
 
Levels
Previous Daily High 96.33
Previous Daily Low 92.44
Previous Weekly High 100.69
Previous Weekly Low 92.77
Previous Monthly High 121.36
Previous Monthly Low 101.17
Daily Fibonacci 38.2% 94.84
Daily Fibonacci 61.8% 93.93
Daily Pivot Point S1 93.39
Daily Pivot Point S2 90.97
Daily Pivot Point S3 89.5
Daily Pivot Point R1 97.29
Daily Pivot Point R2 98.76
Daily Pivot Point R3 101.18


Share: Feed news

Information on these pages contains forward-looking statements that involve risks and uncertainties. Markets and instruments profiled on this page are for informational purposes only and should not in any way come across as a recommendation to buy or sell in these assets. You should do your own thorough research before making any investment decisions. FXStreet does not in any way guarantee that this information is free from mistakes, errors, or material misstatements. It also does not guarantee that this information is of a timely nature. Investing in Open Markets involves a great deal of risk, including the loss of all or a portion of your investment, as well as emotional distress. All risks, losses and costs associated with investing, including total loss of principal, are your responsibility. The views and opinions expressed in this article are those of the authors and do not necessarily reflect the official policy or position of FXStreet nor its advertisers. The author will not be held responsible for information that is found at the end of links posted on this page.

If not otherwise explicitly mentioned in the body of the article, at the time of writing, the author has no position in any stock mentioned in this article and no business relationship with any company mentioned. The author has not received compensation for writing this article, other than from FXStreet.

FXStreet and the author do not provide personalized recommendations. The author makes no representations as to the accuracy, completeness, or suitability of this information. FXStreet and the author will not be liable for any errors, omissions or any losses, injuries or damages arising from this information and its display or use. Errors and omissions excepted.

The author and FXStreet are not registered investment advisors and nothing in this article is intended to be investment advice.

Recommended content


Recommended content

Editors’ Picks

EUR/USD trades with negative bias, holds above 1.0700 as traders await US PCE Price Index

EUR/USD trades with negative bias, holds above 1.0700 as traders await US PCE Price Index

EUR/USD edges lower during the Asian session on Friday and moves away from a two-week high, around the 1.0740 area touched the previous day. Spot prices trade around the 1.0725-1.0720 region and remain at the mercy of the US Dollar price dynamics ahead of the crucial US data.

EUR/USD News

USD/JPY jumps above 156.00 on BoJ's steady policy

USD/JPY jumps above 156.00 on BoJ's steady policy

USD/JPY has come under intense buying pressure, surging past 156.00 after the Bank of Japan kept the key rate unchanged but tweaked its policy statement. The BoJ maintained its fiscal year 2024 and 2025 core inflation forecasts, disappointing the Japanese Yen buyers. 

USD/JPY News

Gold price flatlines as traders look to US PCE Price Index for some meaningful impetus

Gold price flatlines as traders look to US PCE Price Index for some meaningful impetus

Gold price lacks any firm intraday direction and is influenced by a combination of diverging forces. The weaker US GDP print and a rise in US inflation benefit the metal amid subdued USD demand. Hawkish Fed expectations cap the upside as traders await the release of the US PCE Price Index.

Gold News

Sei Price Prediction: SEI is in the zone of interest after a 10% leap

Sei Price Prediction: SEI is in the zone of interest after a 10% leap

Sei price has been in recovery mode for almost ten days now, following a fall of almost 65% beginning in mid-March. While the SEI bulls continue to show strength, the uptrend could prove premature as massive bearish sentiment hovers above the altcoin’s price.

Read more

US economy: Slower growth with stronger inflation

US economy: Slower growth with stronger inflation

The US Dollar strengthened, and stocks fell after statistical data from the US. The focus was on the preliminary estimate of GDP for the first quarter. Annualised quarterly growth came in at just 1.6%, down from the 2.5% and 3.4% previously forecast.

Read more

Forex MAJORS

Cryptocurrencies

Signatures